Finding Breakeven Spread for New CDS Contract
This example shows how to compute the breakeven, or running, spread. The breakeven spread is the premium a protection buyer must pay, with no upfront payments, to receive protection for credit events.
Spreads are expressed in basis points (bp). There is a notional amount associated to the CDS contract to determine the monetary amounts of the premium payments.
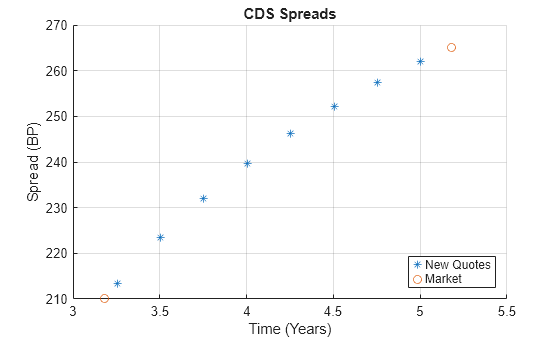
New quotes for CDS contracts can be obtained with cdsspread. After obtaining a default probability curve using cdsbootstrap, you get quotes that are consistent with current market conditions.
In this example, instead of standard CDS payment dates, define new maturity dates. Using the period from three to five years (CDS standard dates), maturities are defined within this range spaced at quarterly intervals (measuring time from the valuation date).
Settle = '17-Jul-2009';  % Valuation date for the CDS
MarketDates = datenum({'20-Sep-10','20-Sep-11','20-Sep-12','20-Sep-14', ...
'20-Sep-16'});
MarketSpreads = [140 175 210 265 310]';
MarketData = [MarketDates MarketSpreads];
ZeroDates = datenum({'17-Jan-10','17-Jul-10','17-Jul-11','17-Jul-12', ...
'17-Jul-13','17-Jul-14'});
ZeroRates = [1.35 1.43 1.9 2.47 2.936 3.311]'/100;
ZeroData = [ZeroDates ZeroRates];

[ProbData,HazData] = cdsbootstrap(ZeroData,MarketData,Settle);

Maturity1 = datestr(daysadd('17-Jul-09',360*(3.25:0.25:5),1));
Spread1 = cdsspread(ZeroData,ProbData,Settle,Maturity1);

figure
scatter(yearfrac(Settle,Maturity1),Spread1,'*')
hold on
scatter(yearfrac(Settle,MarketData(3:4,1)),MarketData(3:4,2))
hold off
grid on
xlabel('Time (Years)')
ylabel('Spread (BP)')
title('CDS Spreads')
legend('New Quotes','Market','location','SouthEast')

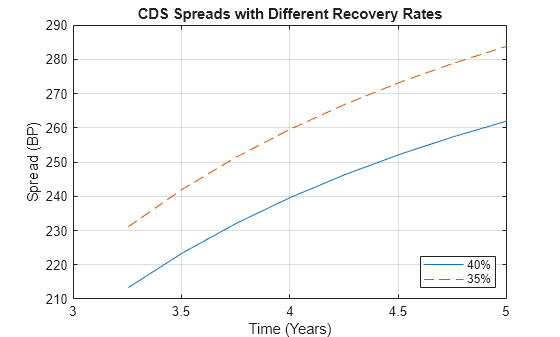
To evaluate the effect of the recovery rate parameter, instead of 40% (default value), use a recovery rate of 35%.
Spread1Rec35 = cdsspread(ZeroData,ProbData,Settle,Maturity1, ...
'RecoveryRate',0.35);

figure
plot(yearfrac(Settle,Maturity1),Spread1, ...
yearfrac(Settle,Maturity1),Spread1Rec35,'--')
grid on
xlabel('Time (Years)')
ylabel('Spread (BP)')
title('CDS Spreads with Different Recovery Rates')
legend('40%','35%','location','SouthEast')

The resulting plot shows that smaller recovery rates produce higher premia, as expected, since in the event of default, the protection payments are higher.
See Also
cdsbootstrap | cdsprice | cdsspread | cdsrpv01
Topics
- First-to-Default Swaps (Financial Instruments Toolbox)
- Credit Default Swap Option (Financial Instruments Toolbox)
- Counterparty Credit Risk and CVA (Financial Instruments Toolbox)