Plotting a 3-D Dome as a Mesh over a Globe
This example shows how to start with a 3-D feature in a system of local east-north-up (ENU) coordinates, then transform and combine it with a globe display in Earth-Centered, Earth-Fixed (ECEF) coordinates.
Step 1: Set Defining Parameters
Use Geodetic Reference System 1980 (GRS80) and work in units of kilometers. Place the origin of the local system near Washington, DC, USA.
grs80 = referenceEllipsoid("grs80","km");
domeRadius =  3000;  % km
domeLat =  39;       % degrees
domeLon = -77;       % degrees
domeAlt = 0;         % km
Step 2: Construct the Dome in Local East-North-Up Coordinates
The local ENU system is defined with respect to a geodetic reference point, specified in this case by (domeLat, domeLon, and domeAlt). It is a 3-D Cartesian system in which the positive x-axis is directed to the east, the positive y-axis is directed to the north, and the z-axis is normal to the reference ellipsoid and directed upward.
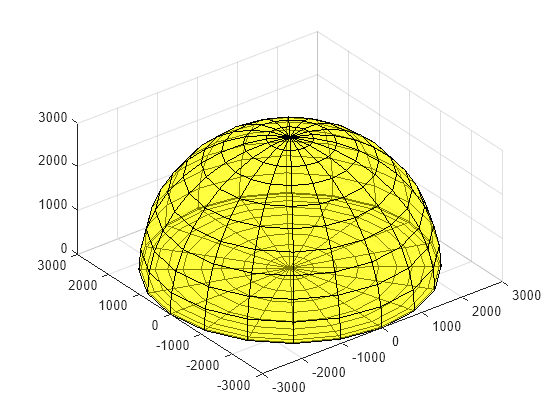
In this example, the 3-D feature is a hemisphere in the z >= 0 half-space with a radius of 3000 kilometers. This hemisphere could enclose, hypothetically, the volume of space within range of a idealized radar system having uniform coverage from the horizon to the zenith, in all azimuths. Volumes of space such as this, when representing zones of effective surveillance coverage, are sometimes known informally as "radar domes."
A quick way to construct coordinate arrays outlining a closed hemispheric dome is to start with a unit sphere, scale up the radius, and collapse the lower hemisphere. It's easier to visualize if you make it semitransparent -- setting the FaceAlpha to 0.5 in this case.
[x,y,z] = sphere(20);
xEast  = domeRadius * x;
yNorth = domeRadius * y;
zUp    = domeRadius * z;
zUp(zUp < 0) = 0;
surf(xEast,yNorth,zUp,"FaceColor","yellow","FaceAlpha",0.5)
axis equal

Step 3: Convert Dome to the Earth-Centered Earth-Fixed (ECEF) System
Use the enu2ecef function to convert the dome from local ENU to an ECEF system, based on the GRS 80 reference ellipsoid. It applies a 3-D translation and rotation. Notice how the hemisphere becomes tilted and how its center moves thousands of kilometers from the origin.
[xECEF, yECEF, zECEF] ...
    = enu2ecef(xEast,yNorth,zUp,domeLat,domeLon,domeAlt,grs80);
surf(xECEF,yECEF,zECEF,"FaceColor","yellow","FaceAlpha",0.5)
axis equal

Step 4: Construct a Globe Display
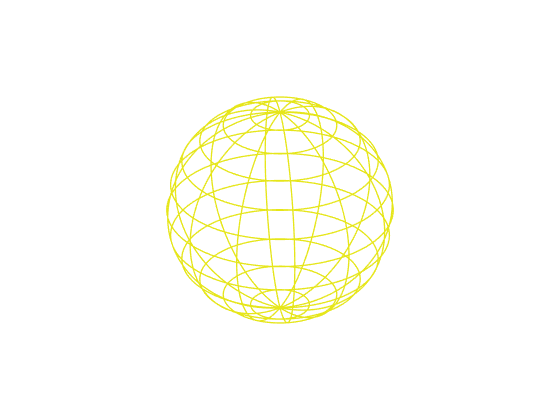
Construct a basic globe display using axesm and globe.
figure
ax = axesm("globe","Geoid",grs80,"Grid","on", ...
    "GLineWidth",1,"GLineStyle","-",...
    "Gcolor",[0.9 0.9 0.1],"Galtitude",100);
ax.Position = [0 0 1 1];
axis equal off
view(3)

Step 5: Add Various Global Map Data
Add low-resolution global topography, coastlines, and rivers to the globe.
load topo60c
geoshow(topo60c,topo60cR,"DisplayType","texturemap")
demcmap(topo60c)

load coastlines
geoshow(coastlat,coastlon,"Color","black")

rivers = readgeotable("worldrivers.shp");
geoshow(rivers,"Color","blue")

Step 6: Add the Dome to the Globe Display
Add the ECEF version of dome to the globe axes as a semitransparent mesh.
surf(xECEF,yECEF,zECEF,"FaceColor","yellow","FaceAlpha",0.5)

You can view the dome and globe from different angles by interactively rotating the axes.
Credit
Thanks to Edward J. Mayhew, Jr. for providing technical background on "radar domes" and for bringing to our attention the problem of visualizing them with the Mapping Toolbox™.