Add Legend to Graph
Legends are a useful way to label data series plotted on a graph. These examples show how to create a legend and make some common modifications, such as changing the location, setting the font size, and adding a title. You also can create a legend with multiple columns or create a legend for a subset of the plotted data.
Create Simple Legend
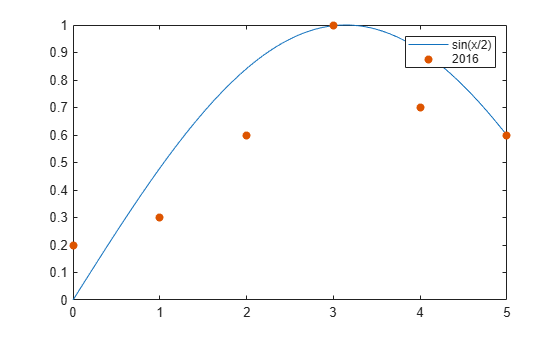
Create a figure with a line chart and a scatter chart. Add a legend with a description for each chart. Specify the legend labels as inputs to the legend function.
figure
x1 = linspace(0,5);
y1 = sin(x1/2);
plot(x1,y1)

hold on
x2 = [0 1 2 3 4 5];
y2 = [0.2 0.3 0.6 1 0.7 0.6];
scatter(x2,y2,'filled')
hold off

legend('sin(x/2)','2016')
Specify Labels Using DisplayName
Alternatively, you can specify the legend labels using the DisplayName property. Set the DisplayName property as a name-value pair when calling the plotting functions. Then, call the legend command to create the legend.
x1 = linspace(0,5);
y1 = sin(x1/2);
plot(x1,y1,'DisplayName','sin(x/2)')

hold on
x2 = [0 1 2 3 4 5];
y2 = [0.2 0.3 0.6 1 0.7 0.6];
scatter(x2,y2,'filled','DisplayName','2016')

legend
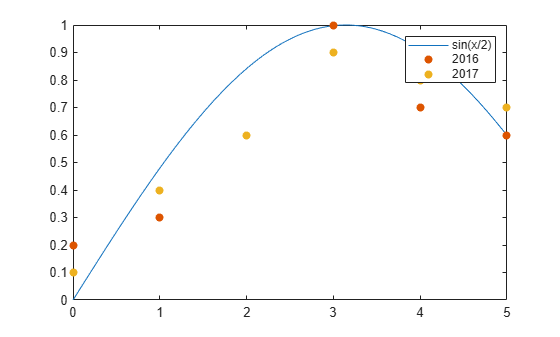
Legends automatically update when you add or delete a data series. If you add more data to the axes, use the DisplayName property to specify the labels. If you do not set the DisplayName property, then the legend uses a label of the form 'dataN'.
Add a scatter chart for 2017 data.
x3 = [0 1 2 3 4 5];
y3 = [0.1 0.4 0.6 0.9 0.8 0.7];
scatter(x3,y3,'filled','DisplayName','2017')
drawnow
hold off
Customize Legend Appearance
The legend function creates a Legend object. Legend objects have properties that you can use to customize the appearance of the legend, such as the Location, Orientation, FontSize, and Title properties. For a full list, see Legend Properties.
You can set properties in two ways:
Use name-value pairs in the
legendcommand. In most cases, when you use name-value pairs, you must specify the labels in a cell array, such aslegend({'label1','label2'},'FontSize',14).Use the
Legendobject. You can return theLegendobject as an output argument from thelegendfunction, such aslgd = legend. Then, uselgdwith dot notation to set properties, such aslgd.FontSize = 14.
Legend Location and Orientation
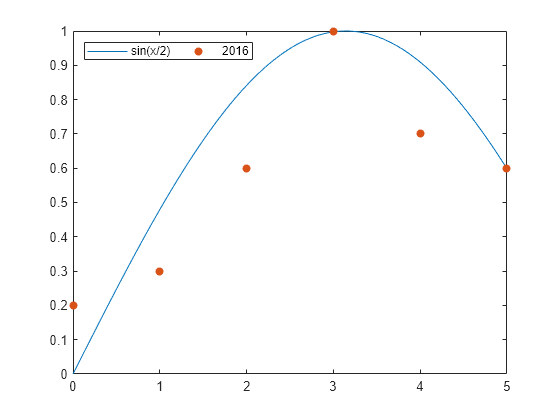
Specify the legend location and orientation by setting the Location and Orientation properties as name-value pairs. Set the location to one of the eight cardinal or intercardinal directions, in this case, 'northwest'. Set the orientation to 'vertical' (the default) or 'horizontal', as in this case. Specify the labels in a cell array.
x1 = linspace(0,5);
y1 = sin(x1/2);
plot(x1,y1)

hold on
x2 = [0 1 2 3 4 5];
y2 = [0.2 0.3 0.6 1 0.7 0.6];
scatter(x2,y2,'filled')
hold off

legend({'sin(x/2)','2016'},'Location','northwest','Orientation','horizontal')
Legend Font Size and Title
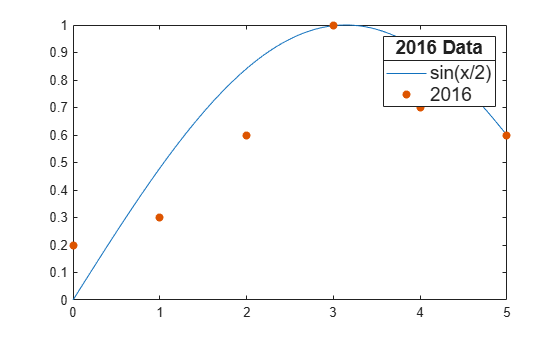
Specify the legend font size and title by setting the FontSize and Title properties. Assign the Legend object to the variable lgd. Then, use lgd to change the properties using dot notation.
x1 = linspace(0,5);
y1 = sin(x1/2);
plot(x1,y1,'DisplayName','sin(x/2)')

hold on
x2 = [0 1 2 3 4 5];
y2 = [0.2 0.3 0.6 1 0.7 0.6];
scatter(x2,y2,'filled','DisplayName','2016')
hold off

lgd = legend;
lgd.FontSize = 14;
lgd.Title.String = '2016 Data';
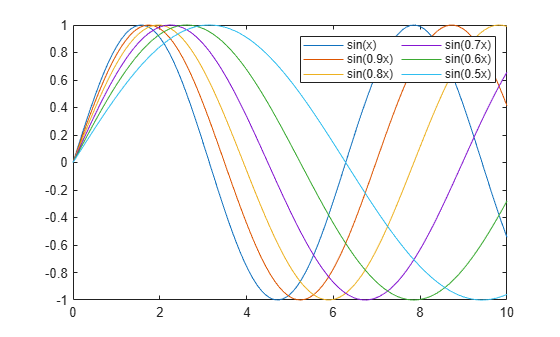
Legend with Multiple Columns
Create a chart with six line plots. Add a legend with two columns by setting the NumColumns property to 2.
x = linspace(0,10);
y1 = sin(x);
y2 = sin(0.9*x);
y3 = sin(0.8*x);
y4 = sin(0.7*x);
y5 = sin(0.6*x);
y6 = sin(0.5*x);

plot(x,y1,'DisplayName','sin(x)')
hold on
plot(x,y2,'DisplayName','sin(0.9x)')
plot(x,y3,'DisplayName','sin(0.8x)')
plot(x,y4,'DisplayName','sin(0.7x)')
plot(x,y5,'DisplayName','sin(0.6x)')
plot(x,y6,'DisplayName','sin(0.5x)')
hold off

lgd = legend;
lgd.NumColumns = 2;
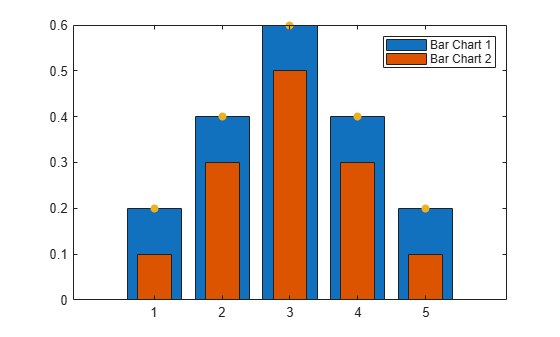
Include Subset of Charts in Legend
Combine two bar charts and a scatter chart. Create a legend that includes only the bar charts by specifying the Bar objects, b1 and b2, as the first input argument to the legend function. Specify the objects in a vector.
x = [1 2 3 4 5];
y1 = [.2 .4 .6 .4 .2];
b1 = bar(x,y1);

hold on
y2 = [.1 .3 .5 .3 .1];
b2 = bar(x,y2,'BarWidth',0.5);

y3 = [.2 .4 .6 .4 .2];
s = scatter(x,y3,'filled');
hold off

legend([b1 b2],'Bar Chart 1','Bar Chart 2')
See Also
You can also select a web site from the following list:
Americas
- América Latina (Español)
- Canada (English)
- United States (English)
Europe
- Belgium (English)
- Denmark (English)
- Deutschland (Deutsch)
- España (Español)
- Finland (English)
- France (Français)
- Ireland (English)
- Italia (Italiano)
- Luxembourg (English)
- Netherlands (English)
- Norway (English)
- Österreich (Deutsch)
- Portugal (English)
- Sweden (English)
- Switzerland
- United Kingdom (English)