Train Binary GLM Logistic Regression Classifier Using Classification Learner App
This example shows how to train a binary GLM logistic regression classifier in the
Classification Learner app using the ionosphere data set which
contains two classes. In the ionosphere data, the response variable
is categorical with two levels: g represents good radar returns, and
b represents bad radar returns.
In MATLAB®, load the
ionospheredata set and define some variables from the data set to use for a classification.load ionosphere ionosphere = array2table(X); ionosphere.Group = Y;Alternatively, you can load the
ionospheredata set and keep theXandYdata as separate variables.On the Apps tab, in the Machine Learning and Deep Learning group, click Classification Learner.
On the Learn tab, in the File section, click New Session > From Workspace.

In the New Session from Workspace dialog box, select the table
ionospherefrom the Data Set Variable list. Observe that the app has selectedGroupfor the response variable, and the rest as predictors.Grouphas two levels.Alternatively, if you kept your predictor data
Xand response variableYas two separate variables, you can first select the matrixXfrom the Data Set Variable list. Then, under Response, click the From workspace option button and selectYfrom the list. TheYvariable is the same as theGroupvariable.Click Start Session.
Classification Learner creates a scatter plot of the data.
Use the scatter plot to visualize which variables are useful for predicting the response. Select different variables in the X- and Y-axis controls. Observe which variables separate the class colors most clearly.
Train the binary GLM logistic regression classifier. On the Learn tab, in the Models section, click the Show more arrow to display the gallery of classifiers. Under Logistic Regression Classifiers, click Binary GLM Logistic Regression. Then, in the Train section, click Train All and select Train All.
Note
If you have Parallel Computing Toolbox™, then the Use Parallel button is selected by default. After you click Train All and select Train All or Train Selected, the app opens a parallel pool of workers. During this time, you cannot interact with the software. After the pool opens, you can continue to interact with the app while models train in parallel.
If you do not have Parallel Computing Toolbox, then the Use Background Training check box in the Train All menu is selected by default. After you select an option to train models, the app opens a background pool. After the pool opens, you can continue to interact with the app while models train in the background.
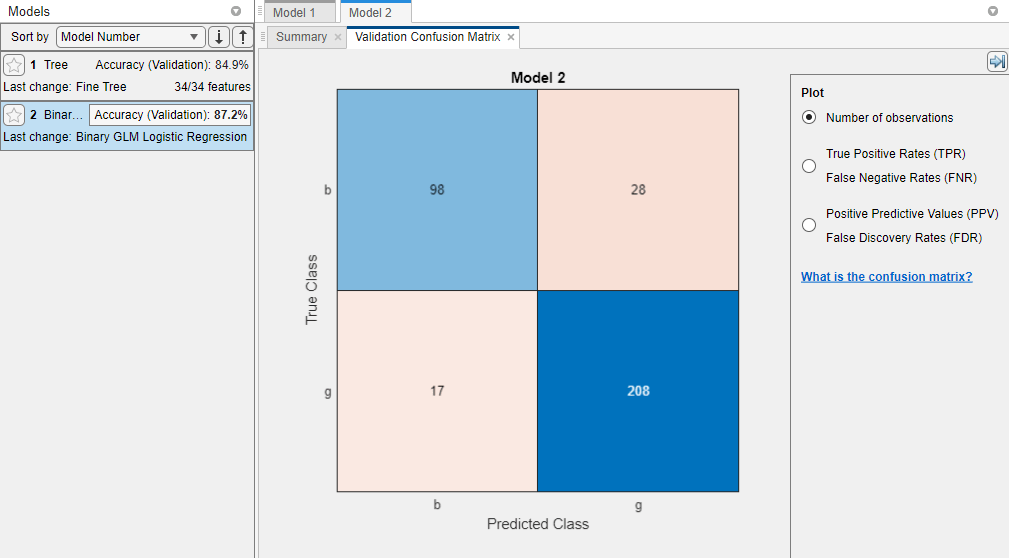
Classification Learner trains the model as well as the default fine tree model. The app outlines in a box the Accuracy (Validation) score of the best model. Classification Learner also displays a validation confusion matrix for the logistic regression model.
Note
Validation introduces some randomness into the results. Your model validation results can vary from the results shown in this example.
To view the results for the model, inspect the Summary tab. To open this tab, right-click the model and select Summary. The Summary tab displays the Training Results and Additional Training Results metrics, calculated on the validation set.
Examine the scatter plot for the trained model. On the Learn tab, in the Plots and Results section, click the arrow to open the gallery, and then click Scatter in the Validation Results group. Try plotting different predictors. Misclassified points are shown as an X.
Inspect the accuracy of the predictions in each class. On the Learn tab, in the Plots and Results section, click the arrow to open the gallery, and then click Confusion Matrix (Validation) in the Validation Results group. View the matrix of true class and predicted class results.
Choose the best model in the Models pane (the best score is highlighted in a box). To improve the model, try including different features in the model. See if you can improve the model by removing features with low predictive power.
First, duplicate the best model. Right-click the model and select Duplicate.
Investigate features to include or exclude using one of these methods.
Use the parallel coordinates plot. On the Learn tab, in the Plots and Results section, click the arrow to open the gallery, and then click Parallel Coordinates in the Validation Results group. Keep predictors that separate classes well.
In the model Summary tab, you can specify the predictors to use during training. Click Feature Selection to expand the section, and specify predictors to remove from the model.
Use a feature ranking algorithm. On the Learn tab, in the Options section, click Feature Selection. In the Default Feature Selection tab, specify the feature ranking algorithm you want to use, and the number of features to keep among the highest ranked features. The bar graph can help you decide how many features to use.
Click Save and Apply to save your changes. The new feature selection is applied to the existing draft model in the Models pane and will be applied to new draft models that you create using the gallery in the Models section of the Learn tab.
Train the model. On the Learn tab, in the Train section, click Train All and select Train Selected to train the model using the new options. Compare results among the classifiers in the Models pane.
You can export a full version of the trained model to the workspace. In the Export section of the Learn tab, click Export Model and select Export Model. In the Export Classification Model dialog box, the check box to include the training data is selected and disabled, because binary GLM logistic regression models always store training data. Click OK in the dialog box to accept the default variable name.
To examine the code for training this classifier, click Generate Function.
Use the same workflow to evaluate and compare the other classifier types you can train in Classification Learner.
To try all the nonoptimizable classifier model presets available for your data set:
On the Learn tab, in the Models section, click the arrow to open the gallery of classification models.
In the Get Started group, click All.

In the Train section, click Train All and select Train All.
To learn about other classifier types, see Train Classification Models in Classification Learner App.
Related Topics
- Train Classification Models in Classification Learner App
- Select Data for Classification or Open Saved App Session
- Choose Classifier Options
- Logistic Regression Classifiers
- Feature Selection and Feature Transformation Using Classification Learner App
- Visualize and Assess Classifier Performance in Classification Learner
- Export Classification Model to Predict New Data
- Train Decision Trees Using Classification Learner App
You can also select a web site from the following list
Americas
- América Latina (Español)
- Canada (English)
- United States (English)
Europe
- Belgium (English)
- Denmark (English)
- Deutschland (Deutsch)
- España (Español)
- Finland (English)
- France (Français)
- Ireland (English)
- Italia (Italiano)
- Luxembourg (English)
- Netherlands (English)
- Norway (English)
- Österreich (Deutsch)
- Portugal (English)
- Sweden (English)
- Switzerland
- United Kingdom (English)
Asia Pacific
- Australia (English)
- India (English)
- New Zealand (English)
- 中国
- 日本Japanese (日本語)
- 한국Korean (한국어)