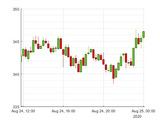
candlestick chart plot
Versión 1.0.0 (1,67 KB) por
pierre-alexandre chauvenet
trading tool candlestick chart
candlestick_plot(high,low,opening,closing,time,varargin)
Draw a chart representing market's opening, high, low, and closing price of a specific time range.
Candle body represents the price range between the open and close while sticks represents the price range between the high and low
time can be datetime format
Citar como
pierre-alexandre chauvenet (2024). candlestick chart plot (https://www.mathworks.com/matlabcentral/fileexchange/79589-candlestick-chart-plot), MATLAB Central File Exchange. Recuperado .
Compatibilidad con la versión de MATLAB
Se creó con
R2020a
Compatible con cualquier versión
Compatibilidad con las plataformas
Windows macOS LinuxEtiquetas
Community Treasure Hunt
Find the treasures in MATLAB Central and discover how the community can help you!
Start Hunting!Descubra Live Editor
Cree scripts con código, salida y texto formateado en un documento ejecutable.
| Versión | Publicado | Notas de la versión | |
|---|---|---|---|
| 1.0.0 |

