Automated data extraction from scanned documents with MATLAB
Overview
Companies and government authorities have huge amounts of data stored in scanned PDF files, for instance invoices, maintenance reports, forms, contracts, and others. While those files contain important information in a structured or semi-structured format like tables, charts or images, it is often a challenge to access and process the data in a convenient, ideally automated way. Efficient data digitization is therefore high on the list of priorities of many organizations.
MathWorks offers a broad range of solutions to extract and process various types of data like text, charts, graphs, tables and other types of data within scanned PDF files. Advanced image and text processing capabilities enable an efficient post-processing and seamless integration in existing workflows.
In this webinar we will specifically show a live example of how to extract and process tabular data from scanned PDFs using a publicly available dataset. Intermediate steps in this workflow include the conversion of scanned PDF files to high-quality images as well as the generation of free form textual information using optical character recognition techniques. The text data is further cleaned and preprocessed before being exported to e.g. Excel files.
Furthermore, you will get insight into various other data extraction use cases, which can be solved using MathWorks technology. The session will be concluded with a discussion about how to apply Machine Learning and Deep Learning methods on the resulting data. Prior knowledge about MATLAB or data extraction techniques is not required.
Highlights
We will cover the following topics:
- Efficient data digitization with MATLAB using different data extraction techniques
- Overview of advanced text analytics and image processing options in MATLAB
- Case study: extraction of tabular data from scanned reports containing agricultural data
- Machine Learning and Deep Learning capabilities for automated data extraction
About the Presenter
Sagar Hukkire, Application Engineer
Sagar Hukkire works as an Application Engineer, focusing on the usage of MATLAB in Data Science, Text Analytics, and Image Processing applications. Prior to joining MathWorks in 2020, he had been working for an international Consultancy developing AI solutions for business applications. Sagar holds a Master of Science degree in Information Technology from the University of Stuttgart, Germany.
Recorded: 19 Oct 2021
Hello, Christoph. Welcome for this webinar on automated data extraction using MATLAB.
Hello Sagar. We should at the very beginning introduce ourselves a bit? You go first?
All right, thanks. Hello, everyone. First of all, thanks for joining this webinar. My name is Sagar Hukkire. I'm an application engineer at The MathWorks, based out of Munich office. My focus here is on image analytics and text analytics. And today's webinar will be showing the different pipeline and the motivation behind this webinar. And now we'll ask Christoph.
So, I'm working in the same team together with Sagar. I'm covering similar things. My background is mathematics, and so I focus really on a lot of data analytics and machine learning, deep learning. Yeah, everything around that, those topics is really of interest to me. Sagar, it's the very beginning, we should briefly motivate, or explain, how we came to actually offering this webinar today. What was the story behind that one?
Right, so when I started working with The MathWorks, with our different clients, they were having this historical data set issues. So most of the data was available in scanned PDF and we didn't have anything in terms of content. We do have a solution which work. But there was no concrete message which people can use of the shape. And we solved one of a-- few of our customers problems which had parallel scenario. And we use the same pipeline. Then we thought, let's make the webinar so that our large audience, which is using our tools, they can also benefit from that. That's-- [CROSSTALK]
Yeah, it was a recurring thing that we encountered. Several of the questions, and all of those were kind of similar. And we thought, okay there seems to be a common trend. And we ought to have some offering about that so that people can learn about it. And this was the root cause, well why we decided for having this webinar. So one thing we should clarify is what is really special about scan PDF versus "normal PDFs". I think this is one of the background topics that are most important to cover. And we should do this at the very beginning. So can you briefly explain scan PDFs and normal PDFs?
Right. Yeah, that's very interesting question. And that's one of-- main point for most of the customer also, in order to differentiate between both of them. So the native PDF, or the normal PDF, which come from the different PDF maker software, so from software which makes this portable document format PDF file. And the way they data is organized on those files is, for example, you have tabular data, you have some kind of lattice information and all those stuff, right? They are built using encoding is there. So when you want to extract those data from Native PDF, like tabular data, or some image data, you can employ some kind of like decoding approaches.
But whereas scan PDF is nothing but you do have physical documents. For example, you have air tickets you have the train tickets, or the invoices, or your National documents. So they are in physical form. And you took the picture from your mobile application, or some kind of scanner application, and then you put it in the digitized form in the PDF.
So the basic difference between both of them is in one in native PDF, one can do the text search, or the information search, using some decoding algorithms, which is very easy to do. But in scan PDF since it's picture, right? So you took the picture and you saved it as PDF, so it makes a little bit harder for you to extract them.
[CROSSTALK]
I mean, the thing is both types will have the extension PDF as the file extension. So you can tell from that one, but they're quite different considering what's inside. That's the main point.
That's true. And it's lying there for many years. With many of our customers, those are in banking, or machine builders, or health care. So, the goal of this webinar also to help them to leverage that data for their own use. Develop AI applications, some data insights reports, likewise.
So I think now we should go into it. And look what we have for today.
Sure. Well, to answer your question on the objectives. We do have some specific agenda types. So, for example, why text analytics? Why? So, we normally see image analytics, and acoustic analytics, and all those things, right? But in order to solve these problems, what are the different areas in text analytics one can use?
And you heard me saying scan PDF. I will highlight why a scan PDF is so much critical. And what are different flavors. It has its own and which we can solve using our pipeline and speaking about pipeline it's not generic I mean to say like it's not only focused on our data set of today's webinar but you can treat it for your problem also it's kind of like one fit for all solution OK and next two items which are kind of Christoph I guess it's your area of expertise in the world how you can take this for your AI application development and we'll brush up a little bit on that point hope you're motivated at least
I hope that I contribute one or two ideas to the last two chapters but let's see
All right. So, AI is like 50, 60 years people are doing research. They are using across all industries nowadays. There is no industry left behind which doesn't use the AI. And the major portion is machine learning algorithms. There are deep learning, which basically deals with these images and even the time series data. Now we can use deep learning approaches to classify or do regression analysis.
And then this comes to natural language processing, which use this machine learning, deep learning, approaches to solve a real world problems of text analytics. So there are different various challenges, per industry m available for this natural language processing. For example, one can see in banking sectors. Or maybe Christoph, you can add some points here if you have some AI experiences in different organizations with real world questions.
Well, I think, one thing we looked at some point was complaints. So customer compliant system where the data comes in the form of emails, or other sources. And you want to, for example, cluster them into different categories, or find out about root causes. This would be a classic application field for language processing.
Right. Clustering sentiment analysis not only we are limited to that. There are various applications, various problems, one can solve with these approaches. And talking about the data, if you see, based upon this Gartner report, 80% of data origin, daily processes, daily unstructured data.
One moment. I'm not really perfectly clear what the actual difference is between structured and unstructured data, as illustrated in this graph. Maybe some of our participants here also don't know the difference. Can you briefly explain that one?
So, that's very nice question. And this is something people do get confused with. So structured data, if I say-- if you talk about the PL/SQL or SQL databases, which format data in terms of columns and rows, your primary key, your secondary key areas. So, for example, let's say my details, like first name, last name, my personal ID, like government ID, or something like that which is organized in tabular format.
But when I talk about unstructured data, for example, data is coming through your Twitter handles, like a webcam feed or sensor signals, which you can't feed directly. Or the images coming from the CCTV. Or the scan PDFs when you use paper and scan and put into directory. Those kind of data is too much, and they are available in very high volume in different organization. And the goal of this organization-- The goal of this webinar is to transform that data, unstructured data, in terms of structured data so one can use it for purposes. Hope I'm clear.
Yeah, I see how once you have transformed this data from unstructured to structured, how it can become much easier.
That's true. That's true. And if you talk about the Internet of Things, and the Industry 4.0, this data is growing exponentially. It's-- people have to spend a lot of time there and this is challenging. And talking about a scanned PDF, today we'll be talking about this US agriculture crop data. And so this how much acreage is there, how vegetables harvested, and which is kind of very identical to different organizations. You do have free text, or maybe you may just are embedded there and how you can take that data out of it. So, that we'll see it. Yeah, talking about the scan period, I would like to ask you, Christoph. How you are seeing this scan PDF in your area of expertise or your customer interactions.
Well, again, I think that many, many companies store information that way, or used to store it until a few years ago. I mean, nowadays most of it is the dry, and early on safer, than a structured form so that they can avoid some of the work later on. But historically, really a lot of it went into storage in the form of a scanned PDF file. So, I assume that each company has lots of those legacy files. At least in many cases, useful information is still contained.
That's true. And another one thing, since we speak about AI, we got very nice algorithms, which are giving 99% of accuracy. We got comfort power from GPU to cloud computing. GPUs are there in market, but one thing is missing for many companies is that the data sets. And either one has to pay, or one has to employ a lot of people affected data sets. So, this can help people to get their data in the proper data set so they can go in AI world, to generate some AI application, to solve their daily problems.
Yeah I see that.
Well, let me define our workflow which we are going to see today. So, normally the data available at the companies, they have some kind of cloud storage, or it is available, or emails, or there are people who are doing this data digitization. They are gathering the data and they're storing in folders also, like centralized machine.
And we do have that scan PDF data source now. So, in the first step, we'll get the PDF of the images, clean images. And we'll see in a bit how we are doing that. And after we have clean images, we are trying to get the free-form text. So that's something we are going to achieve in our next section. And once you have free text, now I would like to ask you Christoph, what application you see we can-- one can do with that pretext.
Well once you have the text, there's many things. For example, many larger companies have some kind of compliant system, of course customer relationship management, system. And you could do some kind of clustering of those complaints, or a root cause analysis of complaints. This is something. Or you can do sentiment analytics on diverse sources based on machine learning. So there's many, many things you could do with that.
Yeah. So, not only with machine learning and deep learning. Yeah. It's one of the wide application area with the free text. But you can store them in well formatted approach. For example, using some key values. For example, when you have invoices. Or for machine builders, they have maintenance reports for the remaining use cycles, and all those component information. Those value you can extract using some digit patterns in MATLAB. Or later patterns in MATLAB, or the key value normal regular expression approaches and store them in well formatted database. And later you can export them as a report, and these reports can be also useful for the management for the companies to make their decisions.
I always think so immediately about machine learning. But it's true that sometimes it's good enough to just store the unstructured data though.
Right. So, this is what the transformation we are doing, from the unstructured data to structured data, using some traditional approaches. And speaking about the machine learning, machine learning approaches, or deep learning approaches, can be also used for the data management system. For example, right now I talked about the key value extraction but there are some smart approaches. For example, named Integrity Commission, which is like supervised learning approach which try to extract the data without giving explicit information.
For example, Company A and Company B has some kind of contract related to music industry. And companies from Germany, company based France so based upon that contract document, one want to extract the information. Let's say, what is the company in between these documents? What are the location and what is the contract all about? So the country will be identified as Germany and France, companies will identify as A and B, and if the content is related to music, so like music industry. Likewise, there are some smart approaches for storing the data in a structured way also.
Speaking all about these approaches let's deep dive into how we have achieved this workflow in MATLAB. So how do you interest, our interests, to Christoph to look into it.
I'm waiting for it all the time.
Thanks a lot. So, before we jump first I would like to explain you what are the different things we have achieved, what are the intermediate steps. Then we'll switch back to the MATLAB, and we'll see the code sections, or different tools and different functionality, how they can also support you to solve your problems. And again, we'll be happy to have questions from Christoph also, who will be asking different intermediate steps and we'll see what it comes.
So, first step is scanned PDF to image. As you see here, we talked a lot about the scan PDF. And this is United States agriculture department data source. It's available freely. And it's open source. We'll share the link also. And one thing you see here, there are some like lightening issues, there is tabular stop is available. So the data is organized in tabular format. And this is very much important whenever you have scanned data. Some shadowing and some lightning is happening.
To get the data in proper format you need to have-- I mean to say, in proper format is like in the searchable text, so you need to have data in more than 300 dots per inch. So for the optical character recognition, or OCR, engine to extract the data. And in MATLAB, we are using the tesseract OCR engine, which supports different languages to detect from your input text. And the thing is it reads left to right, so for that purpose it's very important to deal with such challenges. And that's why whenever we give scanned document directly to any OCR engine it fails miserably. So we'll see how our image processing algorithms come into picture. Do you have anything Christoph on this section?
Just one, more out of curiosity. So what do you have to do with US agriculture data? How does this all come to pass?
Right, so now we are talking about US agriculture data. But you can relate that example in your experiences also. So you work with a lot of machine builder companies, health care companies, so these companies try to maintain their data in semi-structured format. So today we see this agriculture data, maybe in your case there may be some kind of like component information, or some different machines information. And maybe you can relate with your different industry examples where the data is managed kind of tabular pictorial form, but they maintain that standard throughout the different reports.
I trust that the techniques we're going to see are transferable in that way, so that you can apply them to different scenarios.
Yeah this is not only applicable to this problem only. But one can just tweak the-- our approaches and use them for their own data set also.
Okay, then I think we can go into it.
Right. So after that second step is to get the quality text from that particular image. And one thing again, I would like to reiterate, we'll be seeing all the sections in the code files also, how MATLAB do for you. But before I want to give this overview what we are going to show you. So, we got the image. This is how the quality text is coming out of it. So, as I said, we had earlier some those were vertical lines, horizontal lines, right? And that makes a little bit life miserable because OCR can't read it. So those lines-- because for it only, it's trained on the different languages, and the alphanumeric, and all the stuff. And that's why image processing plays a major role.
And we'll see how our toolboxes help you. And if you see now this free form of text. Right, and once we have text, as Christoph was mentioning, he can use those AI approaches. It's not necessarily for this agriculture data set but for other problems. And in this case, we want to just get the tabular data. So maybe just so you can apply this technique for your invoices, personal invoices, or maybe like your bank statements.
I don't even want to know.
All right. Okay, so once you have free text, so we discussed, there are two approaches. There are multiple approaches but two are the generic either you go with a purchase or the data management system approach. Okay, so how we can process that data. So process meant like to get kind of like further use right that's what the goal is to get the data out of the scanned documents. So that's what the next section is talking about the post processing the text information.
So if you see here now we have written it into well formatted Excel file. We applied some digit patterns, later patterns, just to get the vegetables and the different column information. For example, they had some average acreage previous acreage information of vegetables current year. So, my question to you, Christoph, are there any other approaches one can write a data using MATLAB tools.
Yeah, I think that this is a screenshot from a spreadsheet. But once I have it in memory in MATLAB, I can write to many different sources. I could write it to a text file, to a binary file, I could write to a database. I could-- there is just so many options. And again once I have it in memory as a nice table, I can do pretty much anything with it.
Right. Yeah, so, that's pretty good to know. And we need not to fix on the output format they can use different data formats. [CROSSTALK]
Yeah, I take it. This is just an example the screenshot so it could be again, it could write to a key file, in the cloud, whatever suits best to needs.
Okay, so enough about this overview, and the different steps, and the way we are getting results. But it's not only the presentation, we'll see in real life. Also using our MATLAB scripts. And maybe again, we'll interact with gusto to understand more deeper why we like that approach. What are other ways we can solve, or use, to get the data.
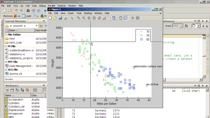
So, let's switch to the MATLAB now. This is MATLAB=B live script. So, MATLAB live script is you notebook version of MATLAB, or interactive version of MATLAB it comes with a lot of features. For example, when can have different apps related to different problem statement. For example, if you are-- since we are talking about machine learning, deep learning, we do have apps. For example, if you are dealing with classification learners, deep network designer. And the best thing about those apps is you don't need to do a lot of coding. You just upload your data set and most of the algorithm selection, or the feature selection, one can do using these apps. So Christoph, do you want to put some words?
I think there is even some app that has to do with OCR. As far as I know.
Right. Yeah. It's OCR trainer. So one can train on language also. It's not necessarily you stay with the pre-trained databases. And we have this live editor. So for example, we do view a lot of options here. So we see a beautiful text so this can be shared with your colleagues in code, as well as the resource together. Or you can export it as a PDF file and share with your other departments or teams.
And we do have a lot of features also. So one can leverage this to, for example, different control options. Those who are dealing with a lot of software development activities, it's kind of useful. And the task when we are doing some, it's in a workflow. The first step is to get the data set right. So there are different pre-processing there cleaning missing data, or outlier removal, or filling the outliers, and all those stops. And not only that, but we have some like custom functions for the tables, timetables, likewise. So, there are like different apps for pre-processing algorithm development, and even for the code generation. I highly encourage all of you to have a look to this live scripts and use those feature in your projects development.
Back to again our data set, so in the first step we are trying to extract the image. And we said we stress on that 300 DPI, right? So, the scan is challenging, as we heard in the earlier discussion. So now we want to extract image out of it. So we are to convert that into images. These are some kind of like functions. We have written helper function and it's written in MATLAB. We do have some ship along with our shipping library. There are some functions which do support for that PDF to image conversion operations. And Christoph, do you want to say a few words on this?
Yeah. I think that one thing that comes to my mind is that basically what we are doing here is two iterations. So one is we iterate over the original source code files, and original PDF files. And the second thing is for each PDF file we go through their pages and render each page, as in this case a PNG and write it to disk. At the same time, if we want to we can also return the image that we read into memory in order to directly work on it in MATLAB, if we desire to do so.
Right. Yeah. And while talking about rendering, this is something there's 300 DPI. We try to maintain even the data is in low resolution, we try to make it up resolution so that it works with our OCR engine. That's something you should have a look whenever you are using these helper function.
With this helpful function, we are trying to get the scan PDF into, as Christoph mentioned, at page level we are converting into images. So, having said that, let's see now the data set in action. This vegetable data set and it has a lot of information if you see, 63 pages. But we are interested only this tab of information, which we've seen on the presentation slide also. If you see it's available on the page 4 and it has some pattern. For example, it gives the information of planted and harvested acreages of different vegetables in the fresh market. We are only focusing on this information.
How one can build automation to extract only that tabular information? So, the basic technique one can use is to put some anchor information. So, for example, in this contest we had planted and harvested acreages in United States. So, what are the data available? Or the page where this data is available? We are trying to extract that page only. So, it may not be fit for your problem right Christoph? It's just working with this problem statement. But maybe for you it might be different case scenarios.
Well, in reality I think that in this case, we use just the string matching, the search for those strings, which denote the beginning and the ending of the section we're interested in. But oftentimes you might not be able to rely directly on something like that because those pedals might change, or the detections might not be good enough, so that you need something more smart. So this is just a simple example. In our case, it works, but in reality sometimes you would have to do something more complex.
Great. Okay. So that things we'll discuss in the next section, how we are dealing with this problem. And in the next section, or the next exercise, we'll discuss more about it. So what we are doing, we saw that video file, right? So now, in the first step we're converting that pre-text into intimate images. So, the iteration is happening or page level. So if you see here-- And this is something, as I was talking about the features of live script, we can see the reserves and code together. And we can have this interactive experience while using the live stream. So, this is just like first image, but we are converting the PDF into subsequent images.
Yeah, I can also see the output in memory. That is this area is 3,508 x 2479 x 3 for it 3 channels RGB. So this is what we get from the processing and get into memory.
Right. Yeah. Okay, so once we are image, as we were mentioning, here what we are trying to do, we are just interested only that image which contains this data, planted how acreage for that we are applying-- this is the anchor information. Okay? So, in your case, maybe you do have data available on the first page and some data is available in the last page, in that case, your approach may change. So there you go with key value.
So, what I mean. For example, you have invoice from a particular company and you are interested in to invoice date, then invoice items, invoice-- maybe tax number, and total. Those things may appear in different pages. So then you apply key value. This is another approach. So what we are doing, we got the image here, then this is the image data stored. This is one of your friend functions whenever you are dealing with similar type of data. So let's say, for example, you have files, text files, then you think about file data store. And now its image data store since we have images, so image data stored It's whenever-- right now we do have limited data but when you're working on millions of images, or thousands of images, different sub folders, then this kind of very useful for you. Christoph, do you want to add something to this?
No, I think that for our example, I mean, we would not have to use that one. But it really pays off when you have more and more data. And it's good practice to use it anyway because you get familiar with the concepts. And it's really flexible and convenient way of programming such a task.
All right. And now we have converted. And one thing is those pages, or those images, are independent to each other. So one can think about making this faster also. Right, Christoph?
Yeah, I think that this would be a good example. We did not actually implement that. But it would not be much trouble to actually read in those files, those PDF, go through those PDF files in peril so using multiple cores, on a machine, might speed up the process a bit.
That's true. It can make you-- we saw like 63 pages right? So, those images, you can make it faster using our parallel computing tool box also. And so, in this case now we are loaded the images, by using image data stored, so we can see in this object variable you have different images. The folders, currently we are working on the one folder, but you can include sub folders also. This is-- there are like different features available to this functionality.
Now, in this section we are reading that image. For example, all the images. And we are applying OCR on top of it, so optical character recognition operation. There are different handles. We'll see in the next section, how OCR on the particular image can be applied to get the data. And this is the anchor information, so that we get only that page where the tabular data is lying. And these are the different functionality like extract between where you can give the patterns. It's tried to find out the data in between that. So, this is very useful whenever we are searching data between two text items or likewise.
So, we try to find out where that page lies, so like indicator. And whenever we get that data, we try to select that image file and store it for further use. So, just to save our time, I have already done it. If you see here, it found the data in page 4. And that particular page has been written as image.
It was always in page 4 but our code actually does not rely on that. So we really searched for the patterns.
Right. Yeah, so we would have written, just selected only page 4 by hard coding because we know that. But we went with this traditional approach just to find the text. Maybe like, in first three files it's on page 4. And let's say, in PDF file file, the tabular data is available on page seven. Then our logic will not work of hard coding, so we went with this extract text.
And let's see that how this data look like. So if you see here we have captured the--, let me open it, we saw on the PDF, the data was there on the page 4. But this tabular data we were interested in sort of page-- I should mention this tab which is more interesting to us. And we are able to get only that select subset of the data set, that's what I mean.
Okay. So, we got now the images. So, how we can use that from the scan period. And for that purpose I would like to go to the next section. How to get the text out of the image files. So again, we are loading that images in using our image data store. Another thing is, we are trying to give you really two parts, so you need not to worry about your local parts and all those things. That's something we have done here in our scripts. Now we have loaded.
So, if you see here, these are the-- those images with table tabular information is loaded. And one thing there are different approaches to get the data. So, for example, when we saw the data, the table was there. And there are some redundant information. On the left side, there is some kind of hard border. And there are some kind of markers and something. So what we are doing. In this case, we are following the region of interest approach. So, how one can calculate these coordinates. So, in our image processing toolbox we have imcrop function.
So, just for times sake, let me see if I can do one example here. So if you see now. This is what I'm trying to say. For example, now I got-- so I this data is lying between this section, all right? , So I'm not interested in reading that remaining data. So, this is what the different options you have. For example, either I can crop and save it or I can get this positions. This is what I mean, so this kind of coordinates, you don't need to use any tools to find out the coordinates. So one can achieve it using imcrop tool also.
Having said about imcrop, so then here comes this-- one can apply different thresholding algorithms also. For example, an image processing operation, where we discuss some kind of lightening effects are there, some noises there then one can use this morphological operation. Like I'm dilate, dilation, or erode, and all those things. And sometimes the images are very not so readable, then there is after kind of one can have a look and different resizing operations. So, for this problem, we stayed with simpler approach. But, yeah, you can have a look to that.
So once we have image then we are giving this to, again, OCR engine because now we are extracting the relevant data from that particular tabular image. So, if we see here, we are giving some control options. So this is optical character recognition function from computer vision toolbox. For example, we are trying to find the data in block. And since we are interested in character and numbers. Because character for the different vegetable letters. And the numbers for how many acreage where plant or vegetable. So that's why we are limiting it. And this helps a lot to get the relevant information.
And finally, we collect that entire text. And we're right into top table data format. So it's again, there are different ways. So, the way I raised their sales. Our table is another data type which helped you to write in your desired format. For example, here we are writing in text. Or maybe in your use case, If you have any different format, you can use also. But for now we want free text, so we are taking into tabular format. Christoph, do you like to add something on this?
Yeah, just one idea that came to my mind. So basically I understand for the purposes of this webinar can we split this into several steps right? So that we can better explain this, and it's not a ball of code at once. But, I think, if you were to implement this in a production environment, you would probably do all in one function call, keep things in memory, and just call the OCR command once. And do this all in a more optimized fashion. But I understand for the purposes of this webinar that we plucked this apart a bit to be able to better explain the single steps.
That's true. Yeah, one can make it in one single function file. And just to-- because this is modularized operation right? So, as we said, since we are using ROI some people can use different approach. For example, they can create one kind of configuration file and use key values. So, these components and plug-in place, you one can remove and prepare own function. That's also totally acceptable.
Now we got the free text. So, let me see if I can show you. See. So, if you see now, we are able to get our first goal to get the free text, or the searchable text, from that scan video file. How you see Christoph this data now?
I'm almost there, I would say so. I still would like it better if it was not a text file. But I had some binary format where the values were actually numeric values but we're getting closer.
Yeah, we're getting closer. And this is the point. We need to do some post-processing. There are some data which is not relevant to you, or neither you can use in your databases, or downstream application. And for that purpose we'll switch to the next section where we can get informative results from that free text.
Okay, so, we got now text files from that images, or forms scan PDF to image and image to text. And as I were mentioning earlier, we discussed about image datastore and this is another type file datastore. So, whenever you are dealing, let's say for example, in this case, we had some text file. Maybe you are dealing with CSVs and your problem statement and likewise. This gives you a lot of flexibility to deal with such large data. Earlier, we got the text files from that images. Now, this is another function which can be useful whenever you are dealing with different types of file data. For example, if you want to work on the text files, a lot of text files, or the CSV files likewise. So, earlier, we saw the image data store and this is also one of the powerful function whenever you are dealing with a lot of similar data type files.
We load the data now using the file data store. , So what we are doing, now we are reading that these text files. We are trying to extract the name. So these are like file parts, which gives you the extensions and all those things. Just to maintain the consistency between input and output.
And here we are getting the split lines. It's like getting the data at lined label. One can have different approaches also, but this seems relevant for our given files, or the data reserve files of the text. Then, what we are doing-- So, earlier we saw there were earlier 10, 15 rows, which had summary information which is not relevant to us. So we are trying to find where that articles, or the first vegetable with art is available. And before that we are trying to just remove this. And this is something it's a little bit faster whenever we are finding this data in the text file.
So, we created now. Again, the tabular text data we extracted into our table. If you see here, it just how that particular vegetables and the acreage information over the years. And as I was mentioning, now we want relevant data, like for there are some kind of numeric information, or there are some information available in text. So, here we are using this letter patterns, and for the numbers we are using digit patterns. Christoph, would you like to add something here?
Yeah, I think that, one point we should make is that you could achieve similar or identical results using regular expressions. But notice this pattern approaches are a bit more readable and a bit more easy to implement. But essentially it's a similar approach to try to extract a numbers and text in different formats from some kind of raw text.
Right. Yeah. So, this gives a little bit easy to read approach. And regular expressions are also there which are supported in MATLAB also. Now we applied this logic of getting the digits, per line level, and letters from that particular line. And once we have extracted, and so for example, if you see the numbers only which contains then that information over the years; how much acreage is for the vegetables and the test results of that particular vegetable names. And then, if you see, we are removing the first column level information in the earlier stages.
But it's--. To make it consistent, input and output, if you see the input words, it had column information, like 10 years outage. What was the acreage information in 1960, 1961, likewise. . We are giving that custom names, which can be also written into in our output data.
So we prepared that column names. So just to make consistent results with input. And as I mentioned in the earlier section, this right table, or the tabular data, when you right index Excel files. And as Christoph was mentioning, we can write in different data formats also. So let me run this. And we'll see now how the results look like.
Yeah, so, what's your comment Christoph on this data?
So Yeah, this is like a good starting point for anything else I want to do in the next steps. So does this easily reusable I'd say.
One can directly use in the approach we were talking about data management, where one can write into databases, create some insight reports. And sometimes you may face forced correction also. That's the logic. It always lies with your problem statement. So, I mean to say, for example, applying some fuzzy logic, or we have spell correction function using in our text analytics toolbox which try to fix your spellings also. And which can be useful for you also.
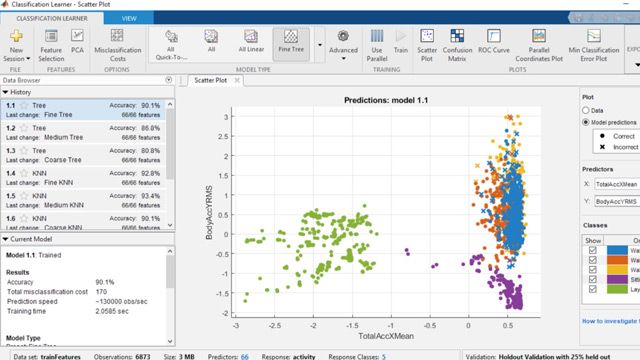
We have achieved our goal to get the tabular data from the scan period. And you can also think about it, your problem statement, how you can use those components just to get the data in your desired format. Okay, so, that's-- I think this is interesting area about Christoph. Well, how deep learning can be used or the machine learning approaches can be used. And this is what we have developed the craft network. And, which uses rigidly 16 model underneath it and deep learning tool boxes.
And I encourage you to check out, get our pages. So what it does--. So, earlier we were having this scan PDF image conversion, and then image to text, and then we are applying some digit pattern regular expressions and trying to get result values. But this may not the similar problem for you. You may have different use cases. For example, some sign boards and some logos from very own text. Information So the-- how one can leverage this deep learning and OCR together. This is what the solution we are providing.
So, what it does-- this is kind of natural skin images, for example, this is the business card of MathWorks. Then we apply this CRAFT network. We tried to find out the text, so not only that, if you see here we are not giving any patterns here. So, just to read website, or the phone number, is try to find out that. Because it's well trained on such kind of data. And then at the end we apply OCR on those bounding boxes and it reads text. So it's again, the free form of text but with desired information. Sounds interesting to me at least where sometimes when the normal traditional approaches doesn't work for such kind of data sets, then this is kind of powerful solution. Christoph, do you see any use cases with your work?
I'd like to try this out. A combination of neural networks plus so to say "classic OCR". Sounds very nice idea.
Right. And in the appendix we are providing a lot of examples. So that one can have a look to them. And with that, I would like to thank everyone for your time. And I ask Christoph if he has any concluding remarks.
No, just again thanks to your attention. And I think now we would open it up for question and answers.
Right.
Download Code and Files
Dataset Sources
Clemens, Michael, 2017, "Raw scanned PDFs of primary sources for workers, wages, and crops", Harvard Dataverse, V1
Related Products
Featured Product
Image Processing Toolbox
Up Next:


Related Videos:


Seleccione un país/idioma
Seleccione un país/idioma para obtener contenido traducido, si está disponible, y ver eventos y ofertas de productos y servicios locales. Según su ubicación geográfica, recomendamos que seleccione: United States.
También puede seleccionar uno de estos países/idiomas:
América
- América Latina (Español)
- Canada (English)
- United States (English)
Europa
- Belgium (English)
- Denmark (English)
- Deutschland (Deutsch)
- España (Español)
- Finland (English)
- France (Français)
- Ireland (English)
- Italia (Italiano)
- Luxembourg (English)
- Netherlands (English)
- Norway (English)
- Österreich (Deutsch)
- Portugal (English)
- Sweden (English)
- Switzerland
- United Kingdom (English)