Development of a Performance Analysis App from Design to Deployment
Killian Pluzanski, Amundi
The Amundi Convexity Solutions team is a leader in derivative management specializing in offering personalized option-based protective overlays to investors. These unique strategies focused on risk management and downside protection challenge the conventional performance metrics typically used to assess investments, such as return on investment or Sharpe ratio.
To address this challenge, the team has developed a robust performance analysis framework. This framework accounts for various dimensions, including downside risk protection, drawdown management, and stress-testing scenarios. By evaluating protective overlays under diverse market conditions, the team gains valuable insights into the effectiveness of these strategies.
A key aspect of these protective overlays is their high level of customization, which is tailored to each investor's specific needs. As a result, each analysis requires the generation of dedicated reports. These reports provide comprehensive insights into the efficiency of the protective overlays by considering the cost-benefit ratio and aligning with broader investment objectives.
To facilitate this process, the team has integrated the project into an application using MATLAB® App Designer. This tool offers a complete environment, encompassing application development and deployment. By utilizing this application, the team can efficiently generate, customize, and present performance analysis reports, enabling clear communication with both internal and external clients.
Published: 1 Nov 2023
So, first of all, thank you. Thank you for assisting to this presentation. My name is Killian Pluzanski, and I'm working at Amundi as a PhD student and quantitative researcher within the convexity solution teams. Today, I'm going to present you the development process of a desktop application using Matlab. But, first, let me introduce the team and what we are doing.
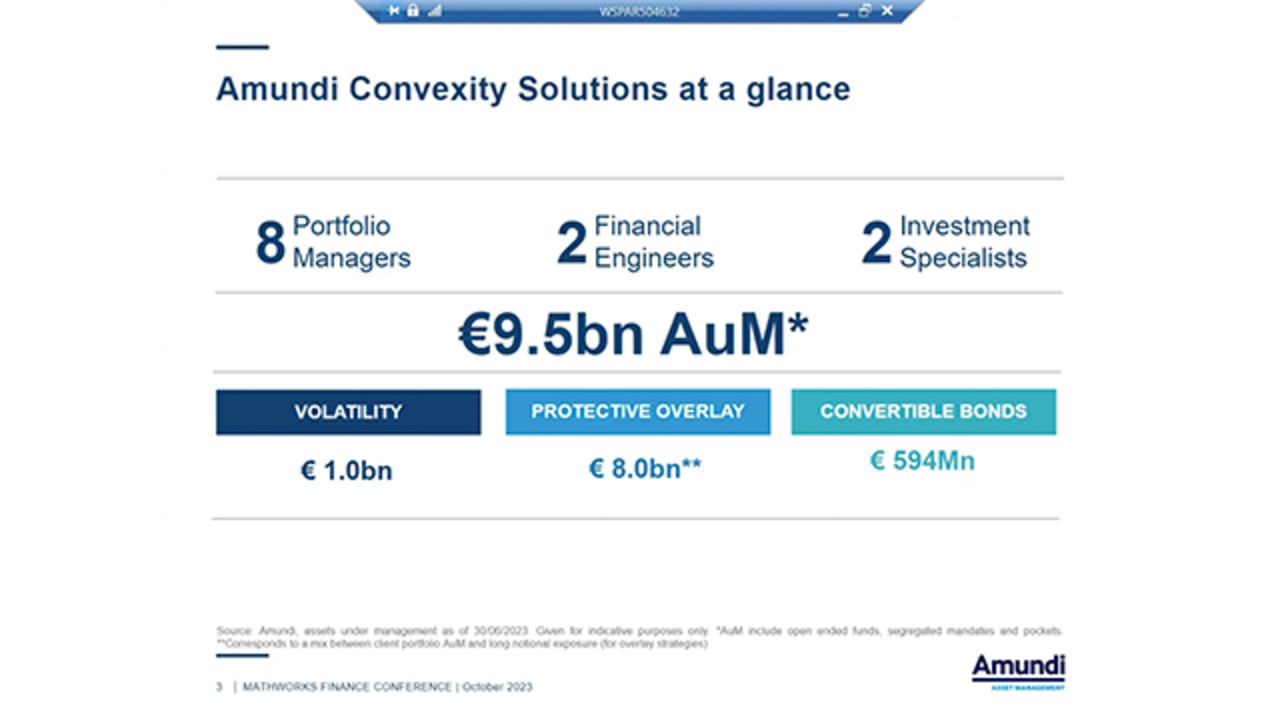
So our team is a very small team composed of 12 people with eight portfolio managers, two financial engineers, and two investment specialists. Our activity represents about 9.5 billion euros of assets under management and is allocated between three main business segments. We have volatility funds, convertible bond funds, and protective overlay solution.
As you can see, protective overlay solutions is one of the most visible business of our activity, and it's also very different from the two others, because it can be associated with structure management. And it comes with different challenges as we will see in the next slide. So what is a protective overlay? Protective overlay is an investment solution. Excuse me.
OK, so first of all is an investment solution designed to reduce downside risk of a target portfolio without altering its asset allocation. Here, what we call downside risk management is globally on a loss control exercise. So when you introduce this type of control, you also introduce the following question. How can we assess the efficiency of a protection program? By design, the efficiency of a protection program represents its ability to generate benefits during market downturn compared to its cost during stable market configuration.
It's like any other insurance product. But if you consider the usual performance measures, such as Sharpe ratio and other standard measures, you will only have an overall information, and you are going to fail to properly isolate the biggest key variables, which are crucial to identify if your protection is very efficient or not. Let me illustrate it with a simple example.
Here, we have a three price series. They are all generated using the same distribution, a normal distribution, but they differ through their data ordering, meaning that we change the order of the data. So from a distributional point of view, they are the same, and as a result, here on the left and the right bottom of the screen, we can see the Sharpe ratio, which is exactly the same between each risk. But if you consider path dependent risk measures, such as maximum drawdown, you will have a completely other story.
The ranking is changing, and what is important with protection? Protection is not necessarily the overall performance of the protection, but more how it behaves over time. If we consider-- let's focus a little bit on a real world example. Here, we have standalone protection, which correspond to a one year roll every six months with a 30% delta and one year input spread. Also, every six months, we have a 30% delta for the long leg and a 10% delta for the short leg.
As you can see here, these protection are beneficial only in very few moments, which are generally associated with periods of high uncertainty, such as 2008 or 2019. I'm sorry, 2020, but can we try this. So, again, if you consider only overall performance measures over all the sample, you are going to miss a lot of information. So that's why, here, we define as rule guest, a new framework to analyze these type of strategies.
We use, basically, two conditional performance measures, one coming from a conditional distribution analysis and the other one coming from drawdown based performance analysis. These two type of analysis allows us to use a target portfolio as a condition, and when the target portfolio is showing some bad behavior, we will see how our protection is behaving. And, in this sense, we are going to be able to analyze correctly the efficiency of our protection.
Let me just show you some example of this type of performance measures we are going to use. Here, we have a distribution analysis, a standard distribution analysis, and the blue line, it corresponds to the target portfolio. And the pink line, you will have a protected portfolio, so the portfolio plus the protection. This is the optimal solution we would like to achieve, because as you can see here, we have concentrated returns around the mean. But we have lower tails.
But what is more important is that left tails in the red area is thinner than the right tails in the green area, meaning that our protection is doing its job. It's protecting well, but does not cost that much. So, here, we have an asymmetry, a compiled asymmetry, which is very nice to have when you are selling protection, because we are targeting this type of distribution. We also have another visual, which is quite nice to have for us, this one.
This is what we call a convexity plot. It's simply a scatter plot, where we represent the relationship between the targeted portfolio, here, the Euro STOXX 50 index and the portfolio, the target portfolio plus a protection. In an optimal world, what we want to see, it's a purely convex pair of profile. Here, as you can see, we are kind of a mix.
We are convex when the target portfolio display negative returns, and we are concave when the target portfolio display positive returns. So with this visual, we are able to see very quickly how behave, overhaul, or strategy, or protection strategy. Now, let's focus a bit more on the drawdown based performance analysis, which it's not that complicated. Because what we are doing here, if you assume that the blue line corresponds to the target portfolio, we are going down to break down this price series into its drawdown periods and recovery periods.
Drawdown periods are represented in red and recovery period in green. So, here, by doing so, we obtain a lot of information. Here, we have a drawdown table. So we can have all the information of both of the drawdowns, and it helped us a lot to identify, during this period, how protection is behaving. And by doing so, we can analyze the ability to reduce the drawdown, but also, the recovery. And, in a sense, we are going to measure the benefits versus this cost, and we can also analyzer something, what we call the decay, the ability of our protection to return its performance, its benefit obtained during a drawdown period.
So here, for instance, if I consider only the first columns, we have a 50% retention rate, meaning we count the average day that our protection is making to give up 50% of its benefit and so on. It's the same for the 30% and 20%. So by doing a drawdown analysis, we can break down everything and have a more focused way to analyze our protection, which is what we are requiring when you are assessing the efficiency of our protection.
So that was on the context part. Now, I'm going to switch on, I think, which is more interesting, the implementation part, how we use Matlab to build an efficient application that helps us in our day to day job. So, first of all, what we do here, we have the following development flow chart.
The first step, we gather all needs. We identify-- oh, I see your question. Which one? This graph? OK, so all my graph here are coming from Matlab. Everything is coming from Matlab in this presentation.
Here, basically, what we are doing, we are gathering all the needs of the different type of people in the team. So we have portfolio manager, financial engineers, and investment specialist. All of these people will have different needs and, also, have a different set of skills. It's going to be important for the next part.
So once we identify our needs, financial engineering engineers gather all these needs, generate the code, and start to define the output with the control of the portfolio manager. So we are in a control and feedback loop for this development part. Once this part is finished, what we do, the financial engineers package and distribute the solution, and then we have, again, a last step corresponding to the feedback loop, kind of a beta test of our solution.
Across the top, showing you what we have done, so why Matlab? Why we are using Matlab? First of all, we have a long history in the team with Matlab. All our proprietary tools are developed in Matlab. We have volatility surface calibration tools, option pricing tools, option based simulation tools, and so on.
So we are very familiar with the Matlab ecosystem, and moreover, Matlab offers very good built in features for code efficiency. For instance, the code analyzer. It indicates you with, like, warning or errors. So it's very nice to have.
You also have something I love a lot, which is the running time. It's going to break down your code by its execution time. So you can identify which line of code or which function you have developed is taking too much time, and you can optimize it. Very, very nice to have. You also have a continuous development. For instance, the algorithms block that allow you to manage your input in a function very effortlessly, which is very, very nice, also.
You have also a good support, reactive and qualitative, and Matlab is integrated with other languages, such as Python. So for us, it's a very good platform to develop code and distribute it within other members in our team. So that's why we use Matlab.
So, now, let's go back to our main issue. It's, once we have generated our code, created a library, how can we share this library with the rest of the team? As I have said before, we have different types of end user with very different expectation, and our solutions are non-standardized solution. So every clients have different needs, and we are designing different solutions. So we need a very high degree of flexibility when we are analyzing the solution we propose to our clients.
Knowing that, I'll go to a solution that's been to develop an application desktop. We use the Matlab App Designer, because it provides a very rich environment with various features to reduce the workflow. For instance, you have the auto-reflow, which is going to adapt your application size in response of the screen size, orientation or platform. For instance, if you are on a tablet, you can have a more appropriate way to visualize your app.
You also have some wide range of components, and one of my favorites is the grid layout, because it offers you dynamic component resizing, meaning that when you are resizing your application, every component is resized as well based on different properties. But it also helps you to have a very good user experience at the end, and also, you have a clear and clean hierarchy between your components, meaning that when you drag and drop the components, you will have something very organized. So you can monitor everything very nicely, and as I said, it reduces the workflow.
So, here, we have the interface, the interface without data, without anything. But the main functionalities are here, and what we have done here, we developed this interface with the main functionalities in only one week, which is very, very fast. Here, we have a data importation block. Here, we have a preview block when you are going to load some charts, try to analyze your protection. You will have some preview, and you also have a report generator view. But we are going to talk about it a bit later.
Then you have, here, an option panel. So you can choose what analyze you want to do, what style you want to have on your chart. You can also change the color to more visual effects, and then, here, we have a report manager.
As I said before, as I introduced before, almost every member of the team need to do reports to communicate on the solution we provide. So it's very important for us to have this block as we will see. I'm going to live test the application just in the next slide, and you will see how nice it is. But, first, just to finish, once we have designed the application, Matlab offers three ways to distribute it, two, which are license free, the web application, or a desktop application, and another one, which is dedicated for Matlab user, the Matlab application.
The Matlab application will create an application, which is going to pop up in your Matlab bar, and the two others of your web applications, you will have a link to a website, basically. And then for the desktop application, you will have an executable file on your desktop. So you have three ways to distribute your application, and two of it are free, which is very, very, very useful. Because, for instance, in our team, only developers have Matlab license, and typically, investment specialists do not have a Matlab license.
OK, so now, let's go into the live demonstration. So I'm going to, just for a moment, quit the presentation. Sorry, I don't mean to. OK, so here we go. Yeah, I'm loading it within Matlab, because I didn't install it on my desktop.
It's like any application. It's an executable file, so you can load it without opening Matlab. I'm doing it just a bit faster. So if you want to design an application, just to go back here. If you want to design an application, you just have to go to the design app, and you will have the Designer app opening and allowing you to design here, your application.
So you have the component library. You will have a preview of your application. You have to drag and drop, and then you have the component browser, which is very useful. Because when you click on something, it will show you where in the app it is, and so on, and so on.
OK, let's just-- OK, sorry, sorry for that. Here we go. Here, we have our main application. So what we are doing here, first of all, we need data. So I'm going to select a template file in Excel, but we also can import data from other sources, which is not the functionality here. But, obviously, you can.
OK, so here, we have some solutions. Basically, let's try something very simple. We are going to select all protected portfolio with the benchmark. Here, what I want to do is the standard cumulative price chart. So let's go.
Let's load the charts, and you have a first analysis. If the style is not fine for you, you can fine tune it here. You can, for instance, just move your legend location, let's say, that way, the orientation of the legend, and you can reset the chart.
As you can see, you have a new chart. You can also change the coloring order as you might see it fit. And then, if the chart is good enough for you, you can-- sorry, because some of my buttons are not properly-- here, you see this is the auto reflow functionality. So I change the size of my application, and I have new design for my application.
I prefer this design here, sorry, because I have more functionality here. I have to ask if I can share this example app, because I will have to ask. So, here, if this chart works for you, you can add it to a report. Basically, what we do here is we click on this button, and here, you have your first chart.
So let's go. Let's try another one. I'm going to use only the standalone overlays. For instance, let's go and try to add this one. Let's load the chart. If you like it, again, so let's go. We can add it to our report.
We have two charts here, and let's do a third one to draw a prediction. OK, the chart is loaded. So let's add the chart to our report, and here, we have a report composed of three charts. If you go back here, you can name your report.
You can select the number of columns in your report you want to see. Since these here only have three charts, I'm going to select one column. OK, I can change the order. I can also-- for instance, here, if you want a chart-- OK, now, let's go. Let's do-- yeah, five charts is good.
You will see why I'm doing this. Let's go. We enter our retention rate. OK, so I like this one again. Let me add it to my report.
OK, four is enough, so let's go. I want two columns, and here, what I can do is update this little in here. And I'm saying, OK, its dimension is going to take one row and two columns. So you will have a bigger chart, and the others are going to be a bit smaller. That's it.
So once we have designed this report, what we do here is load the report to have kind of three. I hope it works. Yes, it works. Nice. So let me put my screen again.
OK, I'm sorry. It's out to see. OK, so what we have here, we have our report. You see, the cumulative price index chart is going to take two columns, and then all of the other chart is going to take only one row and one column.
So this is a preview of your report. Once you have done this report, you can, basically, export it to Excel or into a PDF for fast and easy communication with other members of the team, and all of this application have been developed, again, using the Matlab App Designer and very, very easy. Nothing was really hard about the application. The interface was very, very nice to play with. So my presentation is done.
Featured Product
MATLAB
Up Next:


Related Videos:


Seleccione un país/idioma
Seleccione un país/idioma para obtener contenido traducido, si está disponible, y ver eventos y ofertas de productos y servicios locales. Según su ubicación geográfica, recomendamos que seleccione: United States.
También puede seleccionar uno de estos países/idiomas:
América
- América Latina (Español)
- Canada (English)
- United States (English)
Europa
- Belgium (English)
- Denmark (English)
- Deutschland (Deutsch)
- España (Español)
- Finland (English)
- France (Français)
- Ireland (English)
- Italia (Italiano)
- Luxembourg (English)
- Netherlands (English)
- Norway (English)
- Österreich (Deutsch)
- Portugal (English)
- Sweden (English)
- Switzerland
- United Kingdom (English)