MATLAB for Real-Time Economics
Björn van Roye, Bloomberg LP
The pandemic has significantly changed the way macroeconomic analysis is being done. The rise in high-frequency and alternative data availability make it possible to have a very early view on where major economies are heading. Björn van Roye, Head of Global Economic Modeling, talks about how Bloomberg Economics uses MATLAB® as an integrated real-time macro modeling platform to provide accurate nowcasts, forecasts, and scenarios to their clients.
Published: 14 Nov 2022
I'd like to introduce our first speaker. His name is Bjorn, who is the Global Head of Economic Modeling for Bloomberg Economics in Madrid. He's also a lecturer at the University of Oxford. Previously, Bjorn was the Lead Economist at the ECB, and co-author of the widely-used BEAR toolbox. Bjorn's talk today is titled MATLAB for Real-time Economics. Take it away, Bjorn.
Thank you very much. I'm very pleased to be here, and be able to present. Let me share my screen. Does that work?
Yep, yep, it's working-- very good.
OK, excellent. Yeah, so maybe-- yeah, as you mentioned already, my background is-- I come from the ECB before I joined Bloomberg, where I was leading the global forecast, and where we used MATLAB quite intensively in central banks, also for the economic projections, which lead then to, basically, the preparations for the governing council meetings, which is an ingredient of the modeling work for the decision making process. Two years ago, I moved offices in Frankfurt to Bloomberg Economics.
And since about six months, I moved here-- six months ago, I moved here to Madrid, where I'm now leading our Global Modeling team. So to start with, that you understand a little bit what Bloomberg Economics is about because Bloomberg is widely known as a financial data service provider, as a news agency, and many other things. But in 2017, basically, Bloomberg Economics was created, that basically integrates macroeconomic projections, economic analysis, similar as in a central bank, where we take, basically, data releases, and give them economic interpretation.
So worldwide, we have about 100 economics reporters and 35 economists that you can really think about macro economists. And we basically do very similar work, as is being done in central banks. So my job at the ECB is basically very similar to the one that I'm doing right now. So that being said, is that in Bloomberg, but also in central banks, the world has changed massively, in particular with the COVID shock.
So the background is that you may think-- before, you always had to wait for particular data releases. And you were basically using old data to use it and to assess in real time what's happening right now, and what will happen in the months and years to come. With COVID, things were moving so fast so quickly, that you didn't have the time to wait for the data releases.
So what has really changed in the profession, and also in central banks, and also in Bloomberg, what we are doing, is that you have to have a real time view on everything. And to have a real time view, so where is the economy now, and where is the economy heading, you need to have an infrastructure which is highly efficient and always up to date, and works automatically.
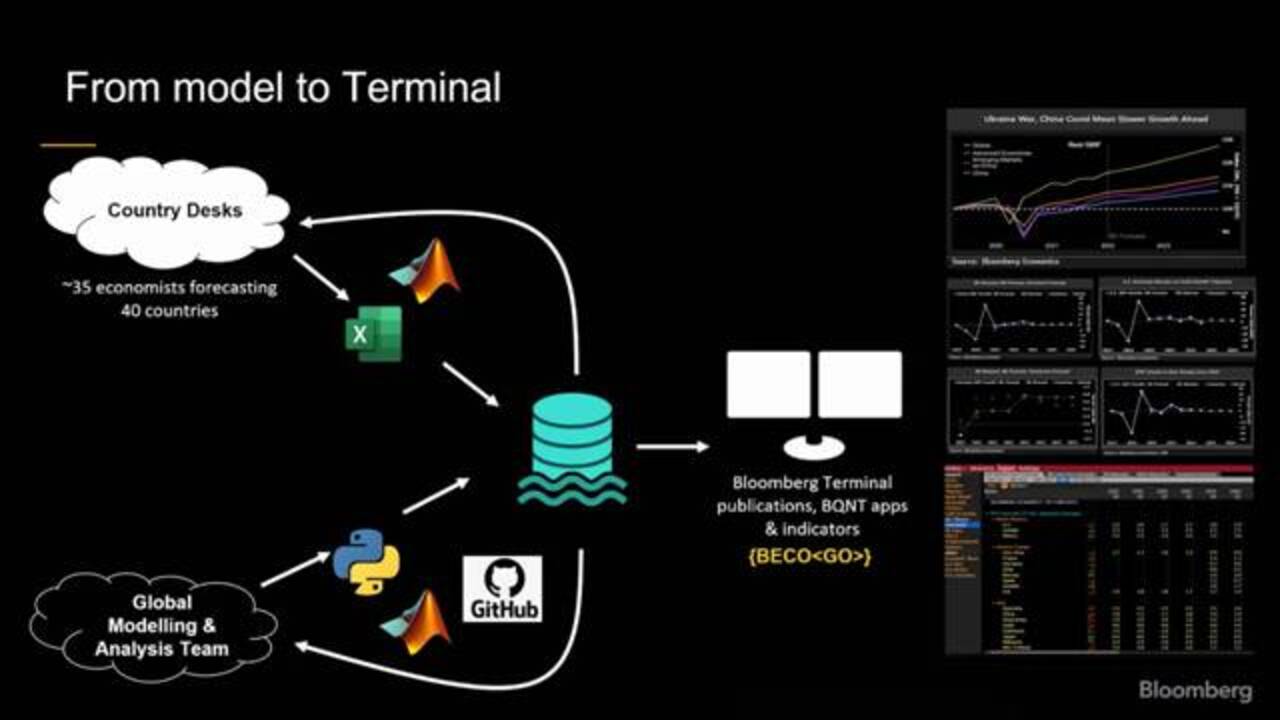
So in Bloomberg, we have, basically, our major platform is the Bloomberg Terminal, as some of you may know. And all what we do is we publish our analysis and forecast and data analysis always on the terminal. How do we get there? So if we get new information, our team is organized in a way that we have our Global Modeling Analysis team here, down there.
And here, you can see the MATLAB item because we, for our modeling work and forecasting, what we use, MATLAB and also Python because the Bloomberg Terminal also runs on Python, and also GitHub, where we basically share our codes, and so on. So we basically process all of this here in our modeling platform. And then we process this to our internal data lake, which is an internal database that Bloomberg hosts. Then we work together with the country teams that are in the US, that are in China, that are in Japan, that are in South Africa, so everywhere, split all over the world.
So they basically do their country analysis, their forecasts, and so on. And we support them building models and so on, and interact via MATLAB with the country teams. And then finally, there's an automated procedure, how we get the model results on the terminal in the right format. And all of this process is highly automized. And I want to talk a little bit about the back end of this, about the models, how we think about it, and how we provide the products to our clients using the back end of MATLAB.
So our modeling platform is basically all based on MATLAB. We use different MATLAB toolboxes for this. So one of the toolboxes you mentioned as well in the intro is the BEAR toolbox. So for forecasting inflation, forecasting growth, forecasting unemployment and many other macro variables, Bayesian Vector Autoregressive Model have proven to be very efficient and highly flexible.
We also use a Dynare package, which is an add-on package for MATLAB, where you can basically write equilibrium models that are also very much used by central banks. And I'll give you an example later on, how this looks like. Then we also have trade models. That's where we worked with academics together. We have risks models where you look a little bit on the distribution of risks for inflation, for GDP, and so on.
And with all these models, we are able to use the parallelization routines for our models that have really big data, or where we use a Monte Carlo Markov chain method for Bayesian analysis, which is absolutely required for our work. And also, we basically automate the models because we update once a new data point comes in, every day, basically, when you think about financial market data that we process on a daily basis, or exchange rates, oil prices, and so on.
And we basically update-- we feed the models on a daily basis with this. So it's basically then running automatically. And this is basically just illustrating here, how this looked like. So we have our different packages of MATLAB code, which we then host on GitHub, and share across the team.
Right, so the modelling team is generally organized in a way that-- like analysis being done in the central bank as well. So the first thing you're interested in is, where are we now, just now? It's a little bit like a rear mirror view on the economy because-- so for example, tomorrow, the US CPI will come out. So everybody has expectations of that.
And we try to know, before the data is released, where we are already. So this is really about narrowcasting. It's not forecasting. It's narrowcasting. And we have a big workstream where we use state-of-the-art methods to have a narrowcast for the most important variables like US prices, US output, US unemployment, non-farm payrolls. But also for other countries, we are working on China, India, so everywhere basically in the world, for the most-watched time series that clients are interested in.
Then also, the second item is economic drivers-- so not only to ask the question, where are we, but also, why are we here? So are we in a supply-constrained world? Or are we in a demand overheating world? So we have to understand why US inflation is rising so fast. Is it because of demand? Is about supply? Is it about expansionary monetary policy? So this is also the backward-looking part, which comes now to the release of the data.
Hi, Bjorn. Sorry to interrupt you. But for some reason, there is a gray box we're seeing here on your screen. I think it's your screen.
A gray box?
Yes.
Oh, sorry. Is that one?
Yes, perfect.
It's gone?
Yep, yep, it's gone.
OK, sorry.
Excellent, thank you.
OK, OK, and then we have the forward-looking part. We have the typical forecasting part, which is about two years out, 2 and 1/2 years out, what central banks look at. And then around that central forecast, we do scenario analysis. So what happens if there's a major shock coming, like the oil price is rising by 30% because of the OPEC cuts back supply? So what happens to US inflation? What happens to your area growth, right? So these questions.
And then finally, you have-- we also have a macro risk analysis, meaning that you also can quantify the tails, so where you have all the distribution. And I'll give you a very short example of how this looks like. So this is how, basically, our team is organized. And you can think about a modelling team in a central bank in a very, very similar way.
So this is an example of an economic nowcast. So with MATLAB in the background, we use routines where we have an automated data read-in from the Bloomberg Terminal. And then we read that into MATLAB, where we have highly efficient, automated routines to do nowcasting and mixed frequency with alternative data, but also traditional data, such as labor market data, industrial production, and so on.
And then you basically-- what you can do is if you update that every day, you can see here in this chart that you have a line which starts negative. So this is an example for the US. And with every data release, the nowcast basically changes. So here was the cutoff. And here, a new quarter starts. An example is on this day, industrial production was released. And directly, it takes that, after a couple of minutes into account.
If it was a positive surprise, it basically updates the nowcast on economic activity. So you see that over time, you can see that the US economy was heating up again. And that's very useful, that you can really know in real time where the US economy is heading. Are we heading towards a recession? Are we heading towards an overheating, or like, back to normal? And basically, you can toggle between that.
I'll give you a quick live example of this. Well basically, this is the economic nowcast. So you have a real time reading of what's happening in the biggest economies in the world. And we have that for many countries. The second thing is what's driving it, right? So we also have sophisticated state-of-the-art models that can give a structural interpretation to what's happening in variables.
So for example, the rising inflation everywhere in the world, this is an example for the US reading, which we did, is OK, once the inflation data comes out, we want to understand why inflation has risen because it has very important information on what the Federal Reserve Board will do in the next meeting, right? And this is what clients are basically, primarily interested in. And we can use this model to disentangle the different drivers of it.
And this is an example that the rising inflation from the beginning of January 2021 to summer 2022, it was a story of three things. It wasn't supply. It was the supply bottleneck crisis, also very much related to COVID. And then you also see the demand component, right? So you have all the catch-up effects after the lockdowns and so on-- and a very big part of energy. And what we found is that monetary policy, actually, hasn't contributed very much to it.
It was mainly a story about energy and energy component, as well as demand and supply. So this is also updated. In an automated routine, once we have a data reading in coming out, we look at our models. And they show us how we should think about it.
In terms of forecasting, we built these apps and provide them to clients, where we this is an example for the federal funds rate forecasts, where you can look at different contributor's forecasts. But we also have our own forecast models for the Fed funds rate that we also provide clients. So we worked on that with all people from the Federal Reserve Board that have a very good understanding how the new framework of the Federal Reserve behaves-- so the average inflation targeting.
And basically, we always provide a nowcast and also a forecast for the effective Federal funds rate. This is also all running in a back end routine over MATLAB, where we have high efficiency in the estimations because sometimes, it's really large models. This is an example of SHOK GO. So this is the scenario tool. So this is the baseline forecast.
And unfortunately, I had to log out of my terminal now because otherwise, I could have shown you what you can do with that. That's a semi-structural model that is used in central banks. So we replicated this, the service model that the Federal Reserve Board is using. And what you can do is basically, you can just toggle this. Like if you toggle up the oil price by $20 USD, it will give you the effects on inflation, on GDP, and so on, on the outlook, and also on the monetary policy reaction.
So this is the scenario tool I mentioned in the beginning, so what if scenarios. What happens to inflation, what happens to global growth, when oil prices rise? What happens if the dollar appreciates by 20%? What happens if the VIX rises by 20 points suddenly? So we all have that scenario tool, basically, in there. MATLAB, we use for the estimation of the central bank models that are in the back end.
So we basically replicate the ECB model. We replicate the Bank of England model, the and, and the Federal Reserve Board. We are also working on models to integrate China and other large emerging markets. And then you can basically just use that as you are a central banker that has this model in house. But we basically, with this infrastructure, we can look at it as were as a central bank. And it's very easy to use.
Finally, it's the macro risk analysis. So we not only look at the baseline forecast because when you think about the uncertainty, generally about macroeconomic projection, is quite high. And clients are primarily interested also in positioning their portfolio for different scenarios in the tails because the median will always be wrong. So that's fact.
So therefore, it's very important to look at the tails and the probability distribution around your central forecast. And this is an example of a US CPI inflation where we have a mean projection. But you see the tails, we can say there's almost zero probability that US inflation next year will drop below 2%, which is a little bit different for the urinea area. It's higher, that probability. But you see also that the distribution is a little skewed here to the upside.
Featured Product
MATLAB
Up Next:


Related Videos:


Seleccione un país/idioma
Seleccione un país/idioma para obtener contenido traducido, si está disponible, y ver eventos y ofertas de productos y servicios locales. Según su ubicación geográfica, recomendamos que seleccione: United States.
También puede seleccionar uno de estos países/idiomas:
América
- América Latina (Español)
- Canada (English)
- United States (English)
Europa
- Belgium (English)
- Denmark (English)
- Deutschland (Deutsch)
- España (Español)
- Finland (English)
- France (Français)
- Ireland (English)
- Italia (Italiano)
- Luxembourg (English)
- Netherlands (English)
- Norway (English)
- Österreich (Deutsch)
- Portugal (English)
- Sweden (English)
- Switzerland
- United Kingdom (English)