Video Player is loading.
Plotting Data in a Loop to Visualize Progress
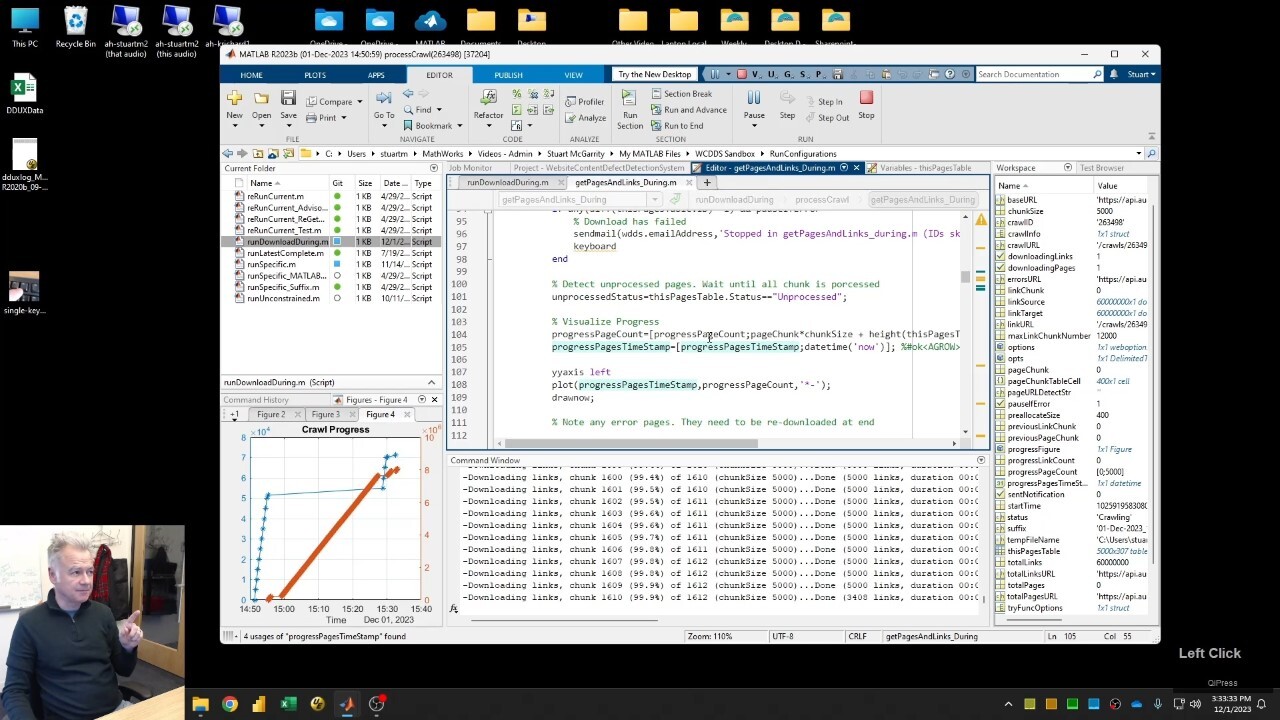
I have a script that runs for many hours and downloads a large amount of data from a web service. It sometimes slows down or even stops, so I want to be able to understand its progress better by visualizing it. I plan to try adding a plot in the main loop and update it each time.
(Originally posted on Stuart’s MATLAB Videos blog)
Recorded: 1 Dec 2023
Featured Product
MATLAB


Seleccione un país/idioma
Seleccione un país/idioma para obtener contenido traducido, si está disponible, y ver eventos y ofertas de productos y servicios locales. Según su ubicación geográfica, recomendamos que seleccione: United States.
También puede seleccionar uno de estos países/idiomas:
América
- América Latina (Español)
- Canada (English)
- United States (English)
Europa
- Belgium (English)
- Denmark (English)
- Deutschland (Deutsch)
- España (Español)
- Finland (English)
- France (Français)
- Ireland (English)
- Italia (Italiano)
- Luxembourg (English)
- Netherlands (English)
- Norway (English)
- Österreich (Deutsch)
- Portugal (English)
- Sweden (English)
- Switzerland
- United Kingdom (English)