Predictive Maintenance Using Deep Learning
Overview
Predictive maintenance allows equipment operators and manufacturers to assess the condition of machines, diagnose faults, and estimate time to failure. Because machines are increasingly complex and generate large amounts of data, many engineers are exploring deep learning approaches to achieve the best predictive results.
In this talk, you will discover how to use deep learning for:
- Anomaly detection of industrial equipment using vibration data
- Condition monitoring of an air compressor using audio data
You’ll also see demonstrations of:
- Data Preparation: Generating features using Predictive Maintenance Toolbox™ and extracting features automatically from audio signals using Audio Toolbox™
- Modeling: Training audio and time-series deep learning models using Deep Learning Toolbox™
Highlights
Explore deep learning approaches to predictive maintenance by detecting anomalies and identifying faults in industrial equipment sensor data.
About the Presenters
Rachel Johnson is the Product Manager for Predictive Maintenance Toolbox at MathWorks. Previously, she was a Senior Application Engineer supporting the Aerospace and Defense Industry. Rachel spent her pre-MathWorks days at the Office of Naval Intelligence where she used MATLAB and Simulink for missile analysis and simulation. She has also taught high school math, physics, and engineering. Rachel holds a B.S.E. in Aerospace Engineering from Princeton University, an M.S. in Aerospace Engineering from the University of Maryland, and an M.A.T. in Mathematics Education from Tufts University.
Sudheer Nuggehalli is a Technical Consultant focused on Artificial Intelligence and Data Analytics at MathWorks. Previously, he was an Application Engineer supporting the Government and Defense Industry with technical focuses in machine learning / deep learning, software and application development, and predictive maintenance. Sudheer holds a B.S.E. and M.S.E. in Electrical Engineering with a focus in control systems from the University of Michigan.
Recorded: 20 Jan 2022
RACHEL JOHNSON: Hi, everyone. Welcome to this webinar on predictive maintenance using deep learning. I'm Rachel, and I'm the product manager for predictive maintenance at MathWorks. So just a bit about my background. Before this, I was an application engineer at MathWorks supporting the aerospace industry. And prior to that, I worked as an aerospace engineer for the US Navy. And I've also spent a few years teaching high school math, physics, and engineering courses. Sudheer?
SUDHEER NEGGEHALLI: All right. Thanks, Rachel. So hey, everyone. Again, my name is Sudheer, and I'm part of the consulting team at MathWorks, focused on AI and data analytics applications, and those specifically related to predictive maintenance and digital twins. Just to give a bit more about my background as well, I did my graduate degree in electrical engineering focused on control systems. And prior to joining the consulting team, I was an application engineer supporting the government defense industries and similar applications of machine learning and deep learning, as well as software and application development. OK. Let's get started. So listen carefully. See if you can determine which compressor has a faulty bearing.
[COMPRESSOR A]
[COMPRESSOR B]
[COMPRESSOR C]
All right. So let's see if you figured it out. All right. So the compressor with the faulty bearing was actually A. So were you right? How confident were you? This is a situation many companies are in. You might be able to identify problems just by listening, but it's important to be accurate.
So before we dive into today's examples, let me go over today's key takeaways. One, to start, small gains can yield big rewards. What I mean by that is when you operate equipment 24/7, even 1% more confidence can translate into millions of dollars in savings. So you should explore a variety of modeling approaches to achieve the best results, including deep learning. Of course, if you build or operate machines, you probably already have useful insights. To succeed with predictive maintenance, you need both domain expertise and AI knowledge. With specialized domain-specific tools and examples, MATLAB helps you do both. Finally, you'll see during this talk how MATLAB can automate the entire predictive maintenance workflow, from accessing data to deploying and operation.
Today I'm going to take you on two journeys in predictive maintenance alongside Rachel, a mechanical engineer who wants to pursue increases in accuracy with two projects. In her first journey, Rachel has compressor acoustic data with labeled faults. In her second journey, Rachel has a lot of data, but not a lot of insight into what it means. So let's meet Rachel.
RACHEL JOHNSON: Hi, everyone. My name is Rachel, and I'm a mechanical engineer at Membrane Manufacturing. I know a lot about the machines we operate. Honestly, I can usually just tell when something is going wrong. Of course, now our company has a new AI initiative, and they want me to start looking at our data in new ways.
SUDHEER NEGGEHALLI: But Rachel isn't an expert in deep learning or AI.
RACHEL JOHNSON: But I really don't know anything about deep learning or AI. I'm a mechanical engineer, not a data scientist. Where do I even begin here?
SUDHEER NEGGEHALLI: Thankfully for Rachel, MATLAB makes it easy to get started. So in any predictive maintenance project, the first step is to consider your data. MATLAB can access data wherever it lives, whether it's in a local file system, databases, or even remote cloud storage. You can also generate synthetic data if you have a model of your machine and interactively labeled failures. At this step, you might also want to extract useful features from your data that more clearly show anomalies or degradation. The next step is probably the most interesting part of the workflow, the AI modeling. Here you will design and optimize predictive models, both traditional machine learning as well as deep learning. As we said before, you'll probably want to try out a variety of modeling approaches and iterate on the best features of your model.
Finally, all of this work isn't useful unless you can deploy your algorithms into production, for example, on the edge, in the cloud, or on your desktop. But once you have your algorithms deployed, the journey doesn't stop there. You might want to use deployed results to iterate and refine other parts of the workflow, including improving the model. All right. So let's follow Rachel on her first journey in predictive maintenance.
RACHEL JOHNSON: I've been working with these air compressors for a long time. And I can tell just by listening when something is wrong. But our maintenance crews have a hard time figuring out what the exact problem is, and that means more downtime and lost revenue. I think we can do better. I have been reading a lot about predictive maintenance and how deep learning might help me interpret all this data.
And honestly, we have a lot of data. We've recorded acoustic time series data from a compressor almost continuously over the last year. I also have the written maintenance logs, so I know which data sets correspond to which of these seven fault codes that we record. I used the Classification Learner app in MATLAB to experiment with some machine learning algorithms at first. The best I was able to do was with a bagged trees model that gave me about 88% overall accuracy. So that's not terrible, but I'm wondering if deep learning can do better.
SUDHEER NEGGEHALLI: OK. So let's walk through the deep learning approach Rachel took. She'll start out accessing her audio files with the MATLAB datastore, then extract audio-specific features using Audio Toolbox. Then she'll train and validate a long short-term memory deep learning network, with her ultimate goal being C code generation for edge deployment.
RACHEL JOHNSON: So let me walk you through the approach I took to solving this problem. I first brought my data into MATLAB. Let me show you what my data looks like first. I've organized it into these eight different subfolders. Each of these folders represents a different fault. So I have about 225 different audio files in each one of the subfolders. One thing that's nice in MATLAB I've found is I can use a datastore to just point to where all of the data lives on my machine. So I have that folder structure, and this datastore is going to recreate that for me. And then I could just step through the data as I go through and analyze it.
The next thing that I needed to do was I needed to separate my data into training and validation sets. So I needed to hold out some of my data for testing because I don't want to test my model on the same data it was trained on. So using splitEachLabel, I can hold out 10% of my data for validation. And I want to make sure that those are represented across all eight of the different categories. So what you'll see here is we've kept about 203 different files per fault type and held out about 22 of each.
Usually the first thing I like to do when I'm starting a problem, though, is I like to just take a look at the data and see what it looks like as a plot. And what we're looking at here is just the signal for a bearing fault. So I can just bring that in directly from my audio file. But really, the goal here is I need to actually extract some features from those signals in order to train my model. I'm not really an expert in signal processing, so I decided I needed to start out just by taking a look at the documentation.
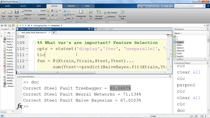
So the first thing I did was I went under Signal Processing and I found Audio Toolbox. And under Audio Toolbox, there's actually a section called Machine Learning and Deep Learning for Audio, which is exactly what I wanted to do. And then under Feature Extraction, I found something called audioFeatureExtractor, which says "streamline audio feature extraction." So that seemed promising. So what this does, this audioFeatureExtractor, is it extracts combinations of different audio features automatically. So I figured I'd start with that.
So using audioFeatureExtractor here, I extracted about 10 different features from my data. And if we run this, I can actually step through my datastore. So what this is doing is just going through each one of my files and extracting those same features from each so that I'll end up with this big trainingFeatures variable that I can use to train my model. I then need to normalize my training features because my network will train better by doing that. And then I need to repeat this process on my validation data set, so generating the same features and normalizing them for that other data set as well.
So now that I've extracted the features, I need to actually use them to train my model. But I'm not an expert in deep learning, so I found another example for a model layer structure, an LSTM, that was used on a similar problem. And I was able to tweak that example to work for my data. So let me start just by loading in the training and validation features that I created in the previous script, and then we can take a look at the layer structure that I'm using for this network.
So I'll run this section of my code to set up all the layers for the network. And once those are defined, I need to set up all the different training options. I actually had to iterate on these a little bit, but I used the Experiment Manager to do this automatically using Bayesian optimization. The Experiment Manager is actually an app in MATLAB that allows me to set up different deep learning experiments interactively. So you can see it's located right here. And it lets me set up different networks and different hyperparameter options and compare results from different data sets as well to see what's going to work best.
So once I've set up those hyperparameters-- let me just set up those options here. I actually need to train the network on my feature set. So to do this-- it would go a lot faster if I was using a GPU. I ended up using a GPU for this. But I'm just going to show a quick recorded video that's sped up a bit of how I trained my model. So what we're seeing here is the accuracy is increasing and the loss is decreasing over time over the course of all of these iterations, which is what we want to see.
So let me load in my model that I had trained previously. And now that I've trained the model, I actually need to test it using that validation data that I held out. So by using classify on my new network, I can pass in those validation features and see what the results look like. Let's take a look at it using a confusion chart. So I ended up with about 95% overall accuracy on my validation set. So that's pretty good. Maybe there's a way I can do even better.
So in the end, the neural network performed better than the original machine learning model I tried. But the algorithm seems to be having a slightly harder time distinguishing between the bearing faults and the flywheel faults. It often gets those two confused. Let me see if I can iterate on this a bit. Maybe there's something I can do to improve the results.
SUDHEER NEGGEHALLI: OK. So take a minute and consider what approaches could Rachel take to actually improve these results. Could she collect more data, tune the hyperparameters of the network, try a different feature set, try a different algorithm, or buy more GPUs? OK, so hopefully you had a chance to go over these. And so just reviewing some of these results, all of these are good approaches to possibly improve predictive results, except buying more GPUs. That would help speed up the training, but won't necessarily give better results.
RACHEL JOHNSON: Well, I've gone through pretty much the entire workflow now. And hey, my algorithm is working. But now I actually need to do something with it. I don't want this to be just a prototype that sits on my PC. I want this to actually work on the factory floor in production so our crews can use these results in real time. So the deployment step is really important to me.
SUDHEER NEGGEHALLI: Using MATLAB, Rachel can automate the deployment process too. She can generate C code for both the feature extraction and prediction algorithms so that she can make predictions in operation from live streaming data. You can also generate low level CUDA and HDL code if you're looking to target other hardware, such as GPUs or FPGAs. If you want to learn more about deploying MATLAB-based AI algorithms, be sure to check out the talk that was presented at this year's MATLAB Expo, "Deploying AI to Embedded and Enterprise Systems." We'll put the link in the chat.
RACHEL JOHNSON: OK, so I started with my air compressors because I actually had labeled data and I knew what types of faults I wanted to predict. And that works pretty well. But unfortunately, most of the machines in our factory aren't like that. We have these industrial welding machines that we're doing scheduled maintenance on every month because it's very important that those don't fail. But because of this, we also don't have many failures. But when failures do happen, they're really unexpected, and they can take down our entire-- oh, excuse me for a second. Hello? What? But didn't they just do maintenance on that machine? Ugh, how long are we going to be down? Yeah, this is really going to mess up our delivery schedule. Yeah. Yeah, OK, OK. Yup. I'll be right over.
SUDHEER NEGGEHALLI: Oh, looks like we lost Rachel there. So Rachel doesn't see many failures, but when they do happen, they're unexpected and can take down the whole production line. She'd like to be able to detect when the welding machines deviate from normal operation, even if she doesn't know what the specific problem is. This is often called anomaly detection.
RACHEL JOHNSON: [VOCALIZING] OK, I'm back. So we have a bunch of vibration data from accelerometers on these machines. But right now, all I really know is that the data right after maintenance is probably normal, at least assuming our crew did everything right. So we have a lot of normal data, but it's harder to say what's going on with the data before maintenance. Honestly, most of that is probably normal too since we have a pretty conservative maintenance schedule. We do have a few data sets that we've been able to definitely tag as abnormal, but we don't know if those are all the types of issues you might see. At least, I think we can use this data to make sure our algorithm is working properly.
Most of the anomalies are mixed in with the normal data. So I started out by trying some statistical and machine learning techniques. I was able to get about 95% accuracy on my validation set using a one-class support vector machine, which is great, but it's not quite good enough. So last week, I talked to an application engineer at MathWorks about the problem. Oh, looks like he's calling me back right now. Hi, Sudheer.
SUDHEER NEGGEHALLI: Hi, Rachel. OK, so I thought about the application we discussed last week. And I think an autoencoder might be a good approach to try.
RACHEL JOHNSON: OK. What's an autoencoder?
SUDHEER NEGGEHALLI: Good question. An autoencoder is a type of neural network that maps input data to an encoding and then attempts to reconstruct the original data by decoding. You can train an autoencoder on features from your normal data, and if the network does a poor job of reconstructing a new input, you can tag that as an anomaly. Let me send you over an example and you can try it out. It might work better than the clustering methods you already tried.
RACHEL JOHNSON: OK, great. I'll try that. Thanks.
SUDHEER NEGGEHALLI: All right. OK. So let's walk through the approach Rachel took. After accessing her data, she extracts and ranks signal features using the Diagnostic Feature Designer app in the Predictive Maintenance Toolbox. And using the top-ranked features, she trains an autoencoder on normal data and validates on the tagged abnormal data. This time, Rachel wants to integrate her algorithms into her company's new cloud infrastructure.
RACHEL JOHNSON: So let me show you how I approached solving this problem. I'll start just by loading my data into MATLAB. And I already had my data collected in a mat file, but let me show you what the data looks like. So when I open up this trainData variable, you'll notice I have three different accelerometer channels, and each one of these contains a single time series signal for each of the different members. So each of these rows represents a sample that was taken from the machine either before or after maintenance, and it's labeled as such.
So next, I like to just take a look at what my data looks like. This is how I usually start solving problems and to better understand my data. What I'll do here is I'll take a look at one sample of data before maintenance and one after maintenance and see if we can tell how they're different. They do look different, but it's maybe hard to tell exactly how they're different. So what we're going to do here is, instead of using the raw signals to train my autoencoder, I actually extracted some statistical features to hopefully get a better separation between the two groups.
So to do this, to extract these features, I used the Diagnostic Feature Designer app in MATLAB. This is part of the Predictive Maintenance Toolbox, and it allowed me to interactively extract and rank my features to figure out which ones will be the most effective for training. So let me open up the Diagnostic Feature Designer. And what you can see is I've already loaded in my data. And if we just take a look at the first channel, this is actually plotting all the members of my data set on top of each other, which isn't very useful to look at. But if I group these by label instead, I can compare the data before and after maintenance.
So again, it's still a little bit tricky to see the differences here, which is why we're going to extract some useful features from our data set. To do this in the Diagnostic Feature Designer, I'm going to start by extracting some basic time domain features from my data. There's some basic statistics here like mean, standard deviation, and RMS, and also some signal processing metrics and some more higher-order statistics too. I'm just going to select all of these because I don't know initially which ones were going to be best. And I can run through and extract all of them and sweep through every member of my data set.
So when this is finished, I can take a look at all of my features collected in a table. So I'm not quite sure which ones are going to be the best, and there are additional features I might want to extract here too. In particular, if I was interested in the frequency content of the signal, I could have also extracted some spectral features. So I'm going to actually rank these features now because I want to see which ones will have the biggest effect. So I ended up ranking these using a t-test. And here I can see what are the top four or five features that are going to separate my data the best. I decided to just pick the top five, but I could have used them all.
So once I've extracted features and ranked them, I need to do something with them to train my autoencoder. So in the app, I could actually export a function to regenerate these features for just the top five or 10 features. So when I do this, I can say I want the top five features and just generate a MATLAB function to do this. So now that I've extracted all the features I need and ranked them using the Diagnostic Feature Designer, I'm ready to train my autoencoder. The first thing I'll do is I'll load in all of my data, my features that I extracted previously, and I'm going to separate these out into two groups, the training set and the test data set. So I'm going to set aside about 10% my data for testing.
Sudheer also sent me a really nice example of an LSTM-based autoencoder architecture, so I ended up being able to tweak that and make it work for my application, doing things like changing the input layer to the number of features that I'm passing in. The thing to note here, though, is I'm only going to be training this on the data after maintenance. So I will train my autoencoder to reconstruct that normal data that happened right after maintenance, but I'll test it on data from before and after maintenance to see how it performs on the two different groups.
So I'll set up my layers in the training options here. And now I'm ready to train the network. I'm not going to retrain it right now because it does take a little bit of time. But I'm going to load in the trained network that I trained previously. So now I'm ready to test the performance of the network on that validation set that I held out earlier. So we'll take a look at the performance of the network on data before and after maintenance.
So what we can see from this plot is the data before maintenance has a higher reconstruction error than the data after maintenance. And this makes sense. Since I trained the model on all the data after maintenance, it would make sense that it would reconstruct that data better. The data before maintenance, on the other hand, looks a bit different. So the model doesn't do as well reconstructing that. So the question to ask here, though, is what level of reconstruction error means there's actually an anomaly.
So I'll take this one step further. I want to try to automate the detection of anomalies. In order to do this, I'm going to define an anomaly as a point with a reconstruction error greater than some threshold times the mean. So what this means is I can take a look at a varying threshold. So let's say I changed this to 1.5. That would actually give a higher threshold of detecting anomalies. So in this case, it would detect about 91% of the anomalies as actual anomalies. It turns out that a threshold of about 0.5 does really well. It gives me a validation accuracy of about 99%. So I'd say that's pretty good.
Well, these results look pretty good. It's clear from the data that the reconstruction error on the abnormal data is higher. And based on the error threshold that I selected, I managed to get 99% accuracy on my validation set. Well, we'll just have to see how that works on new data in the field.
SUDHEER NEGGEHALLI: We mentioned earlier that Rachel wants to deploy her algorithms in a cloud production environment. If you want to learn more about deploying MATLAB-based AI algorithms into production, you should be sure to check out this year's MATLAB Expo talk "DevOps for Software and Systems, Putting Algorithms and Models in Operation." We'll put the link in the chat. OK. It's been six months. Let's see how Rachel's doing.
RACHEL JOHNSON: Hi, everyone. Good to see you again. It's been a while. So ever since the initial predictive maintenance efforts, our projects have really taken off. We've increased our uptime by 10% by being able to better plan our maintenance schedules and avoid surprise failures. We've even started looking into how to expand our analytics to an entire fleet of machines at multiple locations. Ideally, we'll have hundreds of machines streaming live data to the cloud. In the future, we're even thinking about using Predictive Maintenance Toolbox to predict remaining useful life based on historical machine data. Oh, and hey, I got a promotion.
SUDHEER NEGGEHALLI: Awesome. All right. So Rachel's story is based on specific predictive maintenance projects by companies around the world like Airbus, who detected defects in aircraft types using deep learning, or RWE Renewables, who created a virtual temperature sensor to detect anomalies in wind turbine bearings. As we've helped many other customers, we can help you on your journey to predictive maintenance as well. If you have a project you'd like to discuss with us, our consulting team can develop customized engagements, with services ranging from data-driven and model-driven proof of concepts to verify components to enterprise solutions and production deployment. Also, if you would like to learn more about our predictive maintenance capabilities in MATLAB, you should be sure to check out this two-day training course where you will learn hands-on topics such as feature extraction, fault detection and classification, and estimating remaining useful life.
OK. So to recap, we walked through two stories that showed the development of deep learning based models for fault isolation and anomaly detection. When small increases in accuracy can have a big impact, you should try different approaches. And deep learning might be the best approach, but other methods may work better. In this case, Rachel was able to leverage domain-specific tools which helped develop deep learning models that ultimately increased uptime at Membrane Manufacturing. She was also able to automate the entire workflow in MATLAB, including the deployment to both embedded hardware and the cloud. All right. Thanks, everyone, for attending today.
Featured Product
Audio Toolbox


Seleccione un país/idioma
Seleccione un país/idioma para obtener contenido traducido, si está disponible, y ver eventos y ofertas de productos y servicios locales. Según su ubicación geográfica, recomendamos que seleccione: United States.
También puede seleccionar uno de estos países/idiomas:
América
- América Latina (Español)
- Canada (English)
- United States (English)
Europa
- Belgium (English)
- Denmark (English)
- Deutschland (Deutsch)
- España (Español)
- Finland (English)
- France (Français)
- Ireland (English)
- Italia (Italiano)
- Luxembourg (English)
- Netherlands (English)
- Norway (English)
- Österreich (Deutsch)
- Portugal (English)
- Sweden (English)
- Switzerland
- United Kingdom (English)