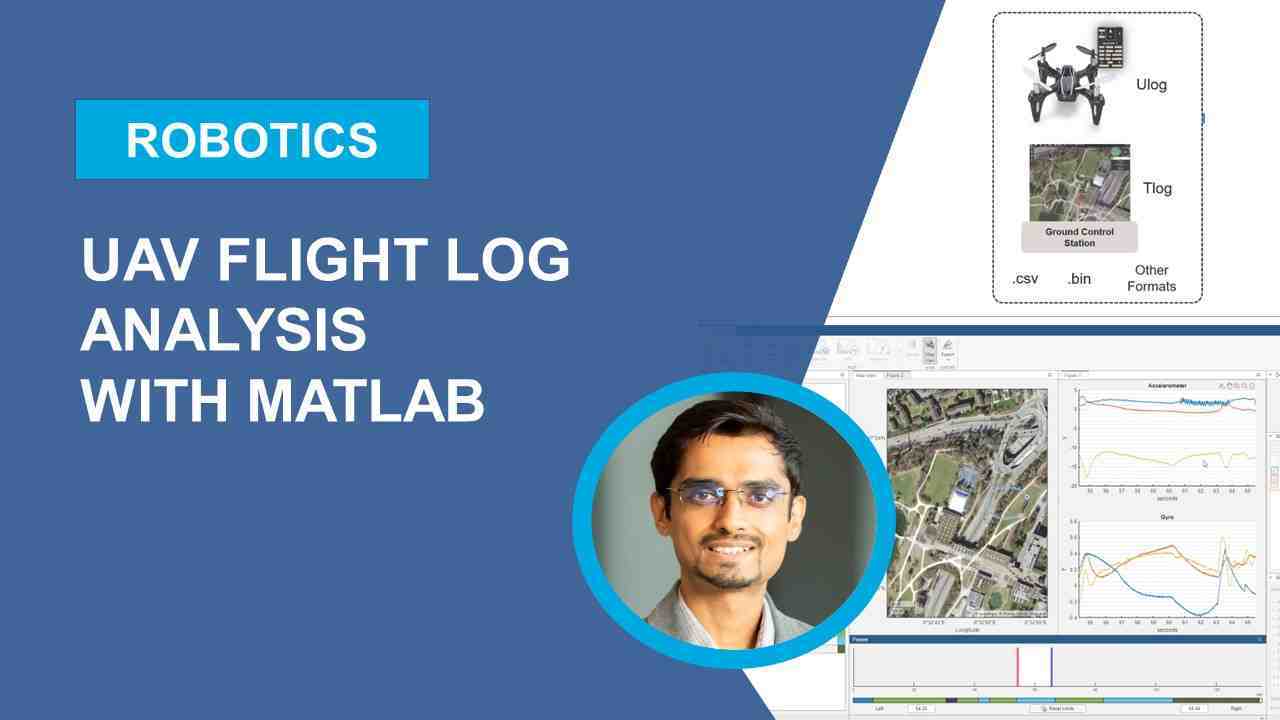
UAV Flight Log Analysis with MATLAB
Overview
Flying a drone, either manually or autonomously, is a complex task. A drone includes several critical parts such as a chassis or platform, motors and sensors. There are numerous reasons why a drone can crash – from incorrect sensor reading to battery issues. It is essential to tune the performance by analyzing the reasons for any failure in simulation or after the test flight.
A flight log analysis tool takes a drone’s log file as an input and provides various plots for flight analysis. You can use the Flight Log Analyzer app with UAV Toolbox in MATLAB for analyzing UAV autopilot flight logs by creating a customized series of plots. You can load different telemetry log files including TLOG, ULOG, and custom file types. You can also use flight log analysis functions to extract and map signals from a telemetry log for generating custom plots.
Highlights
In this webinar, you will learn how to:
- Use Flight Log Analyzer app
- Analyze UAV autopilot flight logs
- Import custom flight log and signal data
- Troubleshoot flight issues by identifying anomalies in flight data
About the Presenters
Mihir Acharya, Product Manager, MathWorks
Mihir Acharya supports Robotics and Autonomous Systems applications at MathWorks, focusing on UAVs and Autonomous Navigation solutions. Prior to MathWorks, Mihir has worked with ABB Corporate Research where he designed robot end effectors for pick-and-place. Mihir also worked with Omron Robotics and developed path planning applications for mobile robots. Mihir has an M.S. in Robotics Engineering from Worcester Polytechnic Institute (WPI).
Venkatesh BalaSubburaman, Development Lead, MathWorks
Venkatesh BalaSubburaman focuses on development of UAV and Robotics algorithms and tools at MathWorks. Prior to MathWorks, Venkatesh was a team lead at Uurmi Systems (acquired by MathWorks) in Hyderabad (India), where he worked on vision and control algorithms for autonomous indoor quadcopters. Venkatesh was worked as an R&D Engineer at Multitel (Belgium), where he developed vision algorithms to detect material defects and crowd analysis. He has also worked on biometrics technologies for automotive use cases at General Motors (Bangalore) and control systems for magnetic bearing at General Electric. He received his B.E in Electronics and Communication Engineering from Ramaiah Institute of Technology, Bangalore and an M.S in Computer Science from Indian Institute of Technology Madras and PhD in Electrical Engineering from École polytechnique fédérale de Lausanne, Switzerland, where his thesis was on object detection and machine learning.
Recorded: 27 Apr 2022
Hello, and welcome to this webinar on UAV Flight Log Analysis with MATLAB. My name is Mihir Acharya. I'm a product manager at MathWorks. And I've been here at MathWorks for more than 40 years working with the robotics and autonomous systems group, specifically supporting the autonomous navigation and UAV applications.
And along with us here today, we have Venkatesh from our development team. And in this session, we will be covering Flight Log Analysis with UAV Toolbox in MATLAB. The development workflow for UAV includes a lot of stages.
We start with planning a mission, providing the machine waypoints to a simulator, where we have the plant model and flight controller with some visualizations to perform closed loop simulations. After evaluating in simulation, we deploy models to a hardware target, and test with hardware in the loop simulations.
And finally, we perform test flights, and execute the machine with the UAV hardware. Now, this may seem like a nice workflow. But there is something that we are missing here. And let me tell you what. It is one of the most important thing. Troubleshooting. Throughout the development of a UAV, we are dealing with a lot of data, and we need to analyze the flight data at various stages of this process.
So while running the simulations or flying the drone, we log all the data, and then this log file is what we use to perform flight log analysis. Now based on which stage you log the data at, there are different problems you can troubleshoot with flight log analysis, such as post flight vibration analysis.
Now, there are multiple types of log files depending on which platform you're using or how you are logging it. For example, the export generates a Ulog file, which is stored on the board itself. Or you may also come across Tlog files or flight telemetry data, which is recorded at the ground control station. And there are various other formats as well.
Now to analyze the flight data, we need a visual representations of the flight signals that are coming from these log files. For which we first import and parse the flight logs, and then plot the flight signals available in the logs. The focus of today's session is to show how you can use the flight log analyzer app with MATLAB to interactively plot and analyze the flight log data.
We will show how this can save you time that goes into writing scripts to visualize the flight data. We will also show some useful features we have designed keeping the UAV development workflow in mind. And later, Venkatesh will show you how you can combine the power of MATLAB script with this app to do more advanced analysis.
All right. So let's get started by looking at where we can start from. So this is the MathWorks documentation website. You can see we are into UAV Toolbox documentation. And we see here among multiple other capabilities. Flight Log Analysis is where we want to go inside and see we have the flight log analyzer app here along with some other objects that we will see later.
So this is what we are going to learn about to begin with. And I'll walk you through this app and one example that is included in the documentation. So let's jump right into MATLAB. We'll copy this command from here and go right into MATLAB.
So here we are into MATLAB now. The command we copied is here we put it in the command window, and we see we have this example opened up right here. This example helps us to learn how to analyze UAV or to pilot flight log using the flight log analyzer app, we are going to look at.
So let's start first with importing Ulog files. So there are multiple ways you can import it. So let's see how you can import it from command in MATLAB. So here we have a test Ulog that is available in this example. So we see that using this Ulog reader object, we can import log here in workspace. And now we can go inside and actually see how it looks.
So we can see here that we have the start and end time of the Ulog, listed out here. But what's interesting here is we can see all the available topics that were recorded in that Ulog. So these are different sensor data coming from the UAV that was recorded with the start and end time stamps and number of messages.
So now let's go inside the flight log analyzer app, and there are multiple ways we can do that. We can either type flight log analyzer in the command window, or we can also browse through these apps menu and go to the flight log analyzer app from here. So since I've already typed it here, I'll just press Enter. And that will open up the flight log analyzer app for me.
So now let's start with importing the log file first. So I'll go ahead and import it from the workspace, because that's where I already had a Ulog file imported. And now let me tell you about the different windows here. So in the middle, we see the map view, and also this is where we will add a lot of different figures.
On the left, we have a list of figures. In a short while, you will see all the figures that we generate here will be listed out here. On the bottom left, we see flight modes. And here we can go through each flight mode. Click on it and see the trajectory on the map view, and we can also click here on the map view to see the latitude and longitude values.
And you'll see that when we are clicking on these map views, there is a banner here, which is changing the timestamps, the start and end timestamp. And accordingly, you'll see the map view changed as well. Now talking about this banner, we can manually adjust the banner as well. And you'll notice on the map view we can see where the drone is now.
Other than manually adjusting like this, you can also type in the values here from the start timestamp to the end timestamp. And we can directly jump over to that part. I will shortly go over on the right in a while. But before, that let's first add some figures here. Now to include different figures, there are multiple ways we can do it. One is to just choose from these pre-defined plots that are listed here.
So let's try IMU data. And that just plots the accelerometer and gyroscope values. Now I also would like to see the trajectory. Now you see that when I added the trajectory just got added along with the other two plots. So I will just go ahead and delete this from here for now. You see it got deleted from this figure list but now I will just add another figure, and then add the trajectory there.
And why I did that is because I want to compare the trajectory. And the IMU data side-by-side. Now talking about side-by-side, how we can do that? So we can just right click here and go to tile view left and right. And here we can see the trajectory and IMU data side-by-side.
And with the panel view, we can jump to a specific timestamp in the trajectory and analyze the accelerometer and gyroscope data at that time. I can also just move this figure over here, and look side-by-side with the map view on the left. And the signal's being plotted on the right.
And this is just a view that I prefer, but you can rearrange them as you like. So now briefly look at what these different windows on the right are. So when I click on a plot here, we can rename this figure or here. So I can call it IMU.
And what I also see here is different signals listed out here accelerometer x, y, and z. So when I double click on it, then I can see-- I can really play around here I can add another fourth signal on this chart.
What I really want to show now is how you can just go to different loiter modes and analyze the accelerometer data. So we can see here that the Z accelerometer data which is color coded in yellow here is less than x and y. And that really tells us that during this loiter mode the vibration was in good range. And similarly, you can go to other loiter modes and keep analyzing the accelerometer data, or even add other signals from here.
Now how to add other signals that are not available in these pre-defined plots is something that these custom plots help you with. So I would just add another figure. Now on this figure, I can add a custom plot here. So let's select a time series plot. You can also select an xy or xyz plot.
But let's see now on this right pane here. We can add a signal to this plot. And right now I'll just keep it line 0 as it's name, but you can also change it. Now on its y-axis, I will add under the attitude target Euler category. I'll add role target. So I'll click on it, and then I'll say update so we can see it plotted the roll target for us.
And right now this panel shows just a small window here. But I can reset the limits to see the full plot from start to end time. And similarly, now I can add another signal on this. And you can select any of the other signal here to plot on top of this. So let's say I want to plot which target here. So this is how we can plot multiple signals on a single plot.
Now, let's say I wanted to plot another signal in the same figure so that we can scroll down and see it. So a report of multiple signals in the same figure window. So I can just go to this again, and I can select another time series.
And this will just give you another plot to add new signals here. So this is how you can use this whole window with all of these several features here and plot multiple signals and analyze your flight log data.
Now let's do some role playing here. So I'm acting as an algorithm design engineer who is running a software in the loop simulation to test some flight control algorithms. Now, I see some issues during the flight mission that I want to analyze. So I'll bring that file in the flight log analyzer app for which I will create a new session first, which clears everything that we had earlier and then we can import a Ulog file directly from Ulog option here.
And let's browse to the location where I have my software in the loop, test log data stored. And I'll bring that you log file in the flight log analyzer app. And this is what my mission looks like. I tried to fly the drone in a triangular trajectory. But we can see that there are some zigzag motion in this part.
Now what I can do as a algorithm design engineer who has less experience with analyzing this data, I can go ahead and plot some of the predefined plots here or predefined signals here, and try to use the features we saw earlier and analyze what's going on here with the accelerometer and gyroscope.
And I would also like to see the position for which I can add another figure trajectory. And now I'm confused. So I really want to take an expert's view. And the good news is the flight log analyzer app lets me save this session and share this with someone who can help me with this.
But before doing that, I will rename these figures so that the saved session makes sense for someone else to start reading it, and help me out with adding more signals in this. So now I will save the session, and I will send it to Venkatesh to analyze it and help me out with figuring out what are the issues going on here.
Thanks Mihir. I have the session open at my end. And we can see the map view and the plots that you added. So we can also go to specific region of interest, and also go to the specific flight number by clicking on the flight mode table.
So before going further, I would like to see more parts for analysis. And also bring in some signals which are not listed in the signal proposal that has actuator control and also the magnetic norm and many other signals. If you go to the MATLAB command prompt to see how to bring them.
I'm in the MATLAB command prompt now and have the editor open. So I have already written some script to do the required additional mapping. So first, we can look at step-by-step to see how to add these signals and map them apparently. So first, we need to create a new log mapping object from the flight log mapping. And we can provide that parameters as Ulog so that there are already some predefined signals available.
And then you can create this mapping function, where we provide the function handle to the time as well as the value functions. So let's run this up to the breakpoint here and I need to let. So you can see on the right in the workspace that we have a lot of mapping available. Let's look at what it contains.
So we can see that now we have the maximum available is being mapped using the classical memory. And you can have it just quick look at what these functions look like get your log table, get your log time, and normally. So let's go have a look at you log table. They are just extracting the specific topic names from the reader and providing the table as an output.
And Ulog lo time just contains just to extract the time stamps from the table. And the Ulog value, where we can actually compute. Like we can extract the signal and do some computation on it. So here computing the knob, the particular signal. And specifically here. We have considered the magnetic norm here.
And we should be able to extract given any data as an input log data, we should be able to extract the magnetic norm. Similarly, I have done for actuator controls. So I have written a script which is easier to maintain.
So I have written a script where we can take in the data in a specific format and do the mapping. So for example, the topic, these are picks for topic messages and the fields. And here I'm looking at the actual controls. And I would like to extract the control field. And the control is an array of four. So we can access each of one of them and name it as well, which you and trust.
So similarly, we can do it for various other signals that are in the Explore. And I have written a script so that is easy for me to add various different topics and fields to this list. And finally, we can call the Configure analyzer, which is going to call the map signal method in the flight logs in the mapping to map the required time and the value from the Ulog data.
So now let us run the complete script. And you can see the log mapping. Let's look at the signals, what has been mapped. So there are more signals that being mapped, and we can see the reports also are being mapped. We are back to the app, and now I would like to input the newly added signals. Due to that, I need to import from the workspace. And select the Ulog mapping, which we created also the log data, which you are interested in analyzing.
So once you click on Import, and now we can see there are more signals available in the signal problem. So let's try to plot the norm and the trust in a new figure. So we just added a figure here. And at the custom time series plot.
And on the signal like we can add two signals. And once you double check, you can choose from the list here. So we can see here the magnetic norm available. And we add that and, and we can also add the actual thrust. Yeah.
So you can see that in orange, we have orange or red, which is the thrust and the magnetic field is shown in blue. So I will look now the session file where I have configured the plots. There's a configure block session five. And I open that session,
I have configured the plots here. And we can look at the position, altitude, velocity, altitude controls, IMU, GPS, Thrust and Magnetic Field, power, and also to the trajectory.
We can also export signals to the workspace so that other tools like signal analyzer can be used for analyzing the time frequency plots. For example, let's explore the extension to the workspace. I have my eyes open, and I have added the acceleration x and z to the signal analyzer.
And you can also look at the time frequency plots. And which is definitely helpful for vibration analysis. So here, we can bring export different signals and which are required for vibration, and then we can use these signals there for analyzing the time frequency plots and finding out the vibrations. With that, I'll hand it over to Mihir.
Thanks, Venkatesh. So you saw how easy it was for me to run my software in the loop tests and share a log file with Venkatesh along with the session that I was looking at, and take his help to move further from there. Now we saw how you can analyze flight log data where the log was generated from software in the loop simulation.
Next, I want to test if my algorithms are working well with hardware in the loop. This is an important step, especially if you're using high fidelity sensor models, which helps with tuning the algorithms in a better way. So this is what the test setup for PS4 hardware in the loop looks like with MATLAB.
To learn more about this, we have an upcoming talk at MATLAB Expo that you can sign up for. So let's go back to the flight log analyzer app. And in a new, session now I will import a u log file from the data that I collected from hardware in the loop workflow.
So for this one, what I really want to show is how you can export the plots and provide annotations for someone to interpret the plots. So I can add the velocity data here. And what I really want to show here is where the x and y velocity changed. And they either decreased or increased.
So I can directly go to the time event where the UAV was taking a turn. And here, I can click on the X velocity to see that on the banner. So we can see here that the x velocity was decreasing somewhere between 40 to 60 seconds in the timestamp.
So now I really want to have this result shared in a report. So let's try exporting the figure so that we have MATLAB figure files that we can annotate. So I will select them all, select the folder, I'll give a name. To exported figures, to test data. And now what we see is our velocity plots exported outside of this app. So now what we can really do here is insert a text arrow, say, decrease in velocity at 50 seconds.
And now I can just save this figure as a PDF. And here we have the PDF report generated from those plots with the annotations. So this really helps you to take your analysis even further and share it as reports among your team. So this was an overview of the flight log analyzer app.
Now if you're doing flight testing simulations for a fixed wing UAV and would like to look at some important flight signals, this example shows how to import and visualize a drone flight log and using 3D animations and flight instrument gauges you can look at the airspeed indicator which shows the speed of the drone, artificial horizon indicator, altimeter and climb rate indicator and the drone coordinator.
So in this session, we saw how you can use the flight log analysis tools with MATLAB to analyze the flight data at various stages of UAV development. We showed how you can import log files, plot predefined or custom signals, and perform flight log analysis with the interactive interface in the app.
You can find more information on the product page for UAV Toolbox, where you will also see the other aspects of UAV development that we support. I really encourage you to check out the documentation page to find out of the box examples that can get you started with your UAV applications. With that, we would like to thank you for attending the session. And we'll welcome any questions you may have now.
Featured Product
UAV Toolbox


Seleccione un país/idioma
Seleccione un país/idioma para obtener contenido traducido, si está disponible, y ver eventos y ofertas de productos y servicios locales. Según su ubicación geográfica, recomendamos que seleccione: United States.
También puede seleccionar uno de estos países/idiomas:
América
- América Latina (Español)
- Canada (English)
- United States (English)
Europa
- Belgium (English)
- Denmark (English)
- Deutschland (Deutsch)
- España (Español)
- Finland (English)
- France (Français)
- Ireland (English)
- Italia (Italiano)
- Luxembourg (English)
- Netherlands (English)
- Norway (English)
- Österreich (Deutsch)
- Portugal (English)
- Sweden (English)
- Switzerland
- United Kingdom (English)