designAuditoryFilterBank
Design auditory filter bank
Syntax
Description
filterBank = designAuditoryFilterBank(fs)filterBank.
filterBank = designAuditoryFilterBank(fs,Name=Value)
[
returns the center frequency and bandwidth of each filter in the filter bank. You can use
this output syntax with any of the previous input syntaxes.filterBank,Fc,BW] = designAuditoryFilterBank(___)
Examples
Call designAuditoryFilterBank with a specified sample rate to design the default auditory filter bank.
fs = 44.1e3;
fb = designAuditoryFilterBank(fs);
The default filter bank consists of 32 triangular bandpass filters spaced evenly on the mel scale between 0 and fs/2 Hz.
numBands = size(fb,1)
numBands =
32
designAuditoryFilterBank is intended for frequency-domain filtering. By default, designAuditoryFilterBank assumes a 1024-point DFT and returns a half-sided frequency-domain filter bank with 513 points.
numPoints = size(fb,2)
numPoints =
513
Read in audio and convert it to a one-sided power spectrum.
[audioIn,fs] = audioread("Laughter-16-8-mono-4secs.wav");

win = hamming(1024,"periodic");
noverlap = 512;
fftLength = 1024;
[S,F,t] = stft(audioIn,fs, ...
               "Window",win, ...
               "OverlapLength",noverlap, ...
               "FFTLength",fftLength, ...
               "FrequencyRange","onesided");
PowerSpectrum = S.*conj(S);
Design a mel-based auditory filter bank. Plot the filter bank.
numBands =32; range = [
0,
4000]; normalization =
"bandwidth"; [fb,cf] = designAuditoryFilterBank(fs, ... "FFTLength",fftLength, ... "NumBands",numBands, ... "FrequencyRange",range, ... "Normalization",normalization); plot(F,fb.') grid on title("Mel Filter Bank") xlabel("Frequency (Hz)")

To apply frequency domain filtering, perform a matrix multiplication of the filter bank and the power spectrogram.
X = fb*PowerSpectrum;
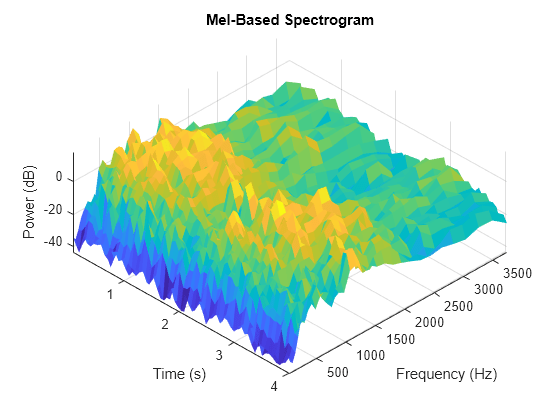
Visualize the power-per-band in dB.
XdB = 10*log10(X);

surf(t,cf,XdB,"EdgeColor","none");
xlabel("Time (s)")
ylabel("Frequency (Hz)")
zlabel("Power (dB)")
view([45,60])
title('Mel-Based Spectrogram')
axis tight
Read in audio and convert it to a one-sided power spectrum.
[audioIn,fs] = audioread("RockDrums-44p1-stereo-11secs.mp3");

win = hann(round(0.03*fs),"periodic");
noverlap = round(0.02*fs);
fftLength = 2048;

[S,F,t] = stft(audioIn,fs, ...
               "Window",win, ...
               "OverlapLength",noverlap, ...
               "FFTLength",fftLength, ...
               "FrequencyRange","onesided");
PowerSpectrum = S.*conj(S);
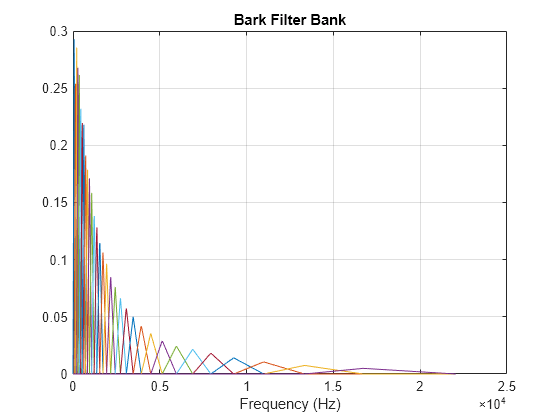
Design a Bark-based auditory filter bank. Plot the filter bank.
numBands =32; range = [
0,
22050]; normalization =
"area"; designDomain =
"linear"; [fb,cf] = designAuditoryFilterBank(fs, ... "FrequencyScale","bark", ... "FFTLength",fftLength, ... "NumBands",numBands, ... "FrequencyRange",range, ... "Normalization",normalization, ... "FilterBankDesignDomain",designDomain); plot(F,fb.'); grid on title("Bark Filter Bank") xlabel("Frequency (Hz)")
To apply frequency domain filtering, perform a matrix multiplication of the filter bank and the left and right power spectrograms.
X = pagemtimes(fb,PowerSpectrum);
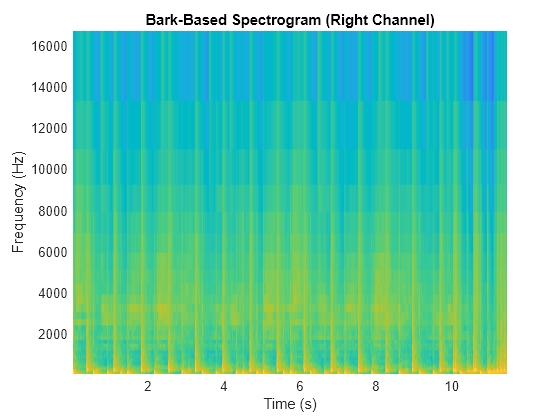
Visualize the power-per-band in dB.
XLdB = 10*log10(X(:,:,1));
XRdB = 10*log10(X(:,:,2));

surf(t,cf,XLdB,"EdgeColor","none");
xlabel("Time (s)")
ylabel("Frequency (Hz)")
view([0,90])
title("Bark-Based Spectrogram (Left Channel)")
axis tight

surf(t,cf,XRdB,"EdgeColor","none");
xlabel("Time (s)")
ylabel("Frequency (Hz)")
view([0,90])
title("Bark-Based Spectrogram (Right Channel)")
axis tight
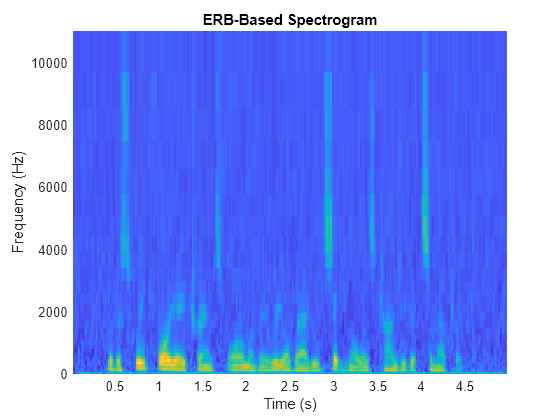
Read in audio and convert it to a one-sided power spectrum.
[audioIn,fs] = audioread("NoisySpeech-16-22p5-mono-5secs.wav");

win = hann(round(0.04*fs),"periodic");
noverlap = round(0.02*fs);
fftLength = 1024;

[S,F,t] = stft(audioIn,fs, ...
               "Window",win, ...
               "OverlapLength",noverlap, ...
               "FFTLength",fftLength, ...
               "FrequencyRange","onesided");
PowerSpectrum = S.*conj(S);
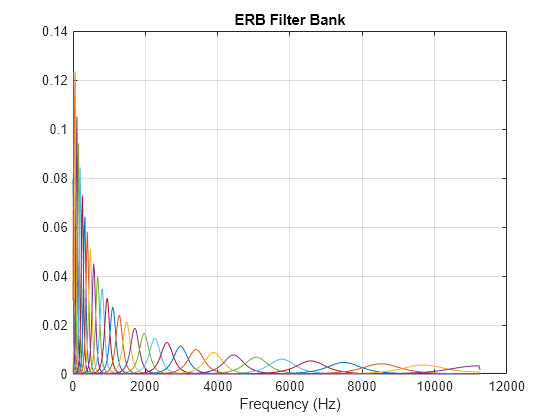
Design an ERB-based auditory filter bank. Plot the filter bank.
numBands =32; range = [
0,
11025]; normalization =
"bandwidth"; [fb,cf] = designAuditoryFilterBank(fs, ... "FrequencyScale","erb", ... "FFTLength",fftLength, ... "NumBands",numBands, ... "FrequencyRange",range, ... "Normalization",normalization); plot(F,fb.'); grid on title("ERB Filter Bank") xlabel("Frequency (Hz)")
To apply frequency-domain filtering, perform a matrix multiplication of the filter bank and the power spectrogram.
X = fb*PowerSpectrum;
Visualize the power-per-band in dB.
XdB = 10*log10(X);
surf(t,cf,XdB,"EdgeColor","none");
xlabel("Time (s)")
ylabel("Frequency (Hz)")
view([0,90])
title("ERB-Based Spectrogram")
axis tight
Input Arguments
Name-Value Arguments
Output Arguments
Algorithms
The mel filter bank is designed as half-overlapped triangles equally spaced on the mel scale. The mel scale can be in the O'Shaughnessy style, which follows [1], or the Slaney style, which follows [5].
The Bark filter bank is designed as half-overlapped triangles equally spaced on the Bark scale. [2]
The ERB filter bank is designed as gammatone filters [4] whose center frequencies are equally spaced on the ERB scale. [3]
References
[1] O'Shaughnessy, Douglas. Speech Communication: Human and Machine. Reading, MA: Addison-Wesley Publishing Company, 1987.
[2] Traunmüller, Hartmut. "Analytical Expressions for the Tonotopic Sensory Scale." Journal of the Acoustical Society of America. Vol. 88, Issue 1, 1990, pp. 97–100.
[3] Glasberg, Brian R., and Brian C. J. Moore. "Derivation of Auditory Filter Shapes from Notched-Noise Data." Hearing Research. Vol. 47, Issues 1–2, 1990, pp. 103–138.
[4] Slaney, Malcolm. "An Efficient Implementation of the Patterson-Holdsworth Auditory Filter Bank." Apple Computer Technical Report 35, 1993.
[5] Slaney, Malcolm. "Auditory Toolbox: A MATLAB Toolbox for Auditory Modeling Work." Technical Report, Version 2, Interval Research Corporation, 1998.
Extended Capabilities
Version History
Introduced in R2019bSee Also
gammatoneFilterBank | melSpectrogram | hz2mel | hz2bark | hz2erb | erb2hz | bark2hz | mel2hz