Run Polyspace Code Prover on Desktop
Polyspace® Code Prover™ is a sound static analysis tool that proves the absence of overflow, divide-by-zero, out-of-bounds array access, and certain other run-time errors in C and C++ source code. A Code Prover analysis produces results without requiring program execution, code instrumentation, or test cases. Code Prover uses semantic analysis and abstract interpretation based on formal methods to determine control flow and data flow in the code. You can use Code Prover on handwritten code, generated code, or a combination of the two. In the analysis results, each operation is color-coded to indicate whether it is free of run-time errors, proven to fail, unreachable, or unproven.
You can run Code Prover on C/C++ code from the Polyspace Platform user interface or using scripts.
If this is your first time using Polyspace, start by using the Polyspace Platform user interface. You can create a project and set configuration options interactively in the user interface with assistance from tooltips and other diagnostic information. See Run Code Prover in User Interface.
Once you set up a project in the Polyspace Platform user interface and complete a few trial runs, you can generate scripts from the project for automated runs. See Run Code Prover Using Scripts.
Example Files
In this tutorial, you will check for run-time errors in the source file
example.c in
polyspaceroot\polyspace\examples\cxx\Code_Prover_Example\sourcespolyspacerootC:\Program
Files\Polyspace\R2026a. See also Installation Folder.
Run Code Prover in User Interface
Polyspace Platform is an integrated environment that supports static analysis and dynamic testing of C/C++ code with Polyspace products. If you set up a project in the Polyspace Platform user interface, you can use the project for running all Polyspace products. For more information, see Polyspace Platform: A Unified Platform for Static Analysis and Dynamic Testing.
Open Polyspace Platform User Interface
To open the Polyspace Platform user interface, do one of the following:
If you set up a shortcut to Polyspace on your desktop or the Start menu in Windows®, double-click the shortcut.
Otherwise, double-click the
polyspace-desktop-uiexecutable inpolyspaceroot\polyspace\binpolyspacerootC:\Program Files\Polyspace\R2026a. See Installation Folder.
Add Source Files
To run an analysis, you have to create a new Polyspace Platform project. A Polyspace Platform project points to source and include folders on your file system.
To create a project:
On the Polyspace Platform toolstrip, select New > Project.
Select a location to save your project, enter a project name,
Demo_project, and click Save.This creates an empty project file,
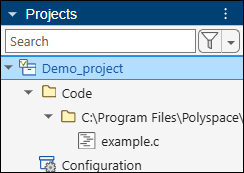
Demo_project.psprjx, and loads this project in the Projects pane of the user interface.On the Projects pane, right-click the Code node and select Add Source File. Add the file
example.cinpolyspaceroot\polyspace\examples\cxx\Code_Prover_Example\sources
Your final project looks like the following:
Instead of explicitly adding sources, you can also create a Polyspace Platform project from a working build command or compilation database. On the Polyspace Platform toolstrip, select New > Project From Build Command. For more information on this workflow, see Create Polyspace Platform Project From Build Command in User Interface.
Configure Code Prover
You can retain the default options associated with a Code Prover analysis or change them as needed. In this tutorial, you will explore the default options used in the analysis and how to change them.
To prove the absence of run-time errors, Code Prover tracks the execution flow in your program. By default, it assumes that your source files contain a main function and all execution flow begins from this main. If you are analyzing a module or library and your source files do not contain a main function, Code Prover generates the main to continue the analysis. To see this default assumption:
On the Projects pane, double-click the Configuration node of the project.
On the Configuration pane, locate the option Verify module or library through search. The option is located on the Static Analysis tab in the Run Time Errors section.
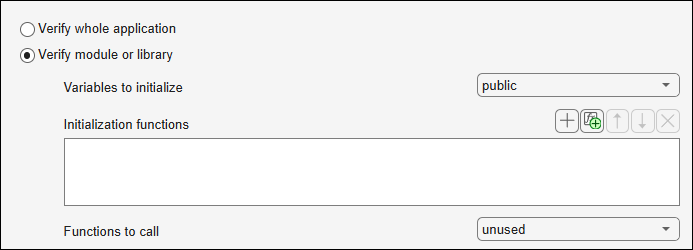
Note that the option is selected. In addition, note the values of these options:
Variables to initialize is set to
public, indicating that all non-static non-const global variables have potentially any value when read for the first time in the generatedmain.Functions to call is set to
unused, indicating that the generatedmaincalls only those functions that are otherwise not called in the source files provided.
If you always want to provide a
mainfunction and do not want to use the generatedmain, select Verify whole application. In this tutorial, the fileexample.cdoes not have amainfunction, so retain the default selections.
Run Code Prover
Once you have added sources to your project and set appropriate configuration options, you can start running Code Prover.
To run Code Prover:
On the Polyspace Platform toolstrip, select Prove Absence of RTEs (the option is located below Find Issues). A pane opens where you can follow the progress of analysis.
Once the analysis is complete, you see the message:
On the Results pane in the lower left corner of the user interface, you see a node Demo_project Results with an RTE node below.End of Polyspace analysis
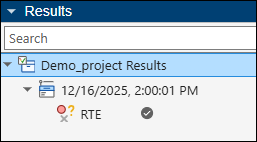
Right-click the RTE node and select Open Dashboard (or double-click the RTE node) to open a dashboard with an overview of the results.
To continue with the results review, see Review Code Prover Results in Polyspace Platform User Interface.
Run Code Prover Using Scripts
You can run Polyspace Code Prover using scripts that run system commands. This tutorial shows how to generate scripts from the previously configured Polyspace Platform project so that you can run Code Prover at the command line.
To generate a script and run Code Prover on Windows, you can do the following steps. The steps on Linux® and Mac are similar, except for the fact that a Shell script is generated instead of batch files.
To save typing the full path to Polyspace system commands, add the path
polyspaceroot\polyspace\binPathenvironment variable on your operating system. Here,polyspacerootC:\Program Files\Polyspace\R2026a.Open a terminal and navigate to the folder where you saved the previous project
Demo_project.psprjx. Enter this command:polyspace-project -generate-launching-script-for Demo_project.psprjx -output-dir scripts -product code-proverOnce the script generation is complete, a message suggests how to run the generated script.
Run the script using the suggestion in the previous message. For example, if the generated script is called
launchingCommand.bat, enter the following to run this script:cd scripts .\launchingCommand.batWhen the analysis is complete, Code Prover saves the results in a file
ps_results.pscpin a folderresults. To open these results, enter the following:polyspace-desktop-ui results\ps_results.pscp
To continue with the results review, see Review Code Prover Results in Polyspace Platform User Interface.
To run Code Prover at the command line without going through a project, see Run Polyspace Analysis from Command Line or the reference page for the polyspace-code-prover command.