Run Polyspace Analysis on Code Generated with Embedded Coder
If you generate code from a Simulink® model by using Embedded Coder® or TargetLink®, you can analyze the generated code for bugs or run-time errors with Polyspace® from within the Simulink environment. You do not have to manually set up a Polyspace project.
This topic uses Embedded Coder for code generation. For analysis of TargetLink-generated code, see Run Polyspace Analysis on Code Generated with TargetLink.
For a tutorial with a specific model, see Run Polyspace Analysis on Code Generated from Simulink Model.
You might want to analyze the generated code outside Simulink with other handwritten code. In this workflow, extract the Polyspace options and run the analysis, for instance, from the Windows® Command Line. See Run Polyspace Analysis on Generated Code by Using Packaged Options Files. For older releases, Polyspace supports navigating from the generated code back to model. See Navigate Back to Model.
Prerequisites
Before you run Polyspace from Simulink, you must link your Polyspace and MATLAB® installations. See Integrate Polyspace with MATLAB and Simulink.
Generate and Analyze Code

Configure Code Generation and Generate Code
To configure code generation and generate code from a model, do one of the following:
On the Apps tab, select Embedded Coder. Then, on the C Code tab, select Quick Start. Follow the on-screen instructions.
On the C Code tab, click Settings and configure code generation through Simulink configuration parameters. The chief parameters to set are:
Type (Simulink): Select Fixed-step.
Solver (Simulink): Select auto (Automatic solver selection) or Discrete (no continuous states).
System target file (Simulink Coder): Enter
ert.tlcorautosar.tlc. If you derive target files fromert.tlc, you can also specify them.Code-to-model (Embedded Coder): Select this option to enable links from code to model.
For the full list of parameters to set, see Recommended Model Configuration Parameters for Polyspace Analysis.
Alternatively, run the Code Generation Advisor with the objective Polyspace and see if the required parameters are already set. See Configure Model for Code Generation Objectives by Using Code Generation Advisor (Embedded Coder).
To generate code from the model, on the C Code tab, select Generate Code. You can follow the progress of code generation in the Diagnostic Viewer.
Analyze Code
To analyze the code generated from the model, click anywhere on the canvas. The Analyze Code from field on the Simulink toolstrip shows the model name. Select Run Analysis.

When using Embedded Coder, Polyspace checks for generated code when you click Run Analysis. If no generated code is present or if the model has changed since the last Polyspace analysis, Polyspace first launches the code generation process and then starts the analysis.
If the current model is referenced in another model and you want to verify the generated code in the context where the model is referenced, instead of Code Generated as Top Model, use Code Generated as Model Reference. In the latter case, Polyspace does not launch code generation automatically if there's no generated code. When analyzing Code Generated as Model Reference, generate code before running the Polyspace analysis.
You can follow the progress of the analysis in the MATLAB Command Window.
The results open automatically unless explicitly disabled. By default, the results are saved in a folder results_ in the current folder. Each new run overwrites previous results. You can change the default folders or save the results to a Simulink project. To make these changes, on the Polyspace tab, select Settings.ModelName
If you have closed the results and want to open them later, on the Polyspace tab, select Analysis Results. To open a result prior to the last run, select Open Earlier Results and navigate to the folder containing the previous results.
Review Analysis Results

Review Results in Code
The results appear in the Polyspace Platform user interface on the Results List pane. Click each result to see the source code on the Source pane and details on the Result Details pane. See also:
Navigate from Code to Model
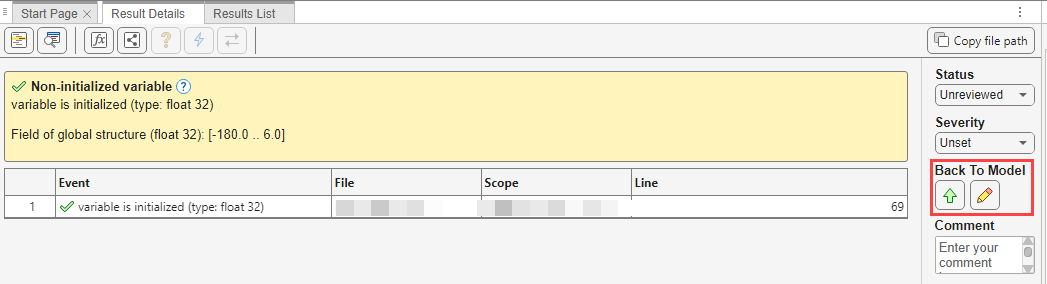
For each result in the Result Details pane, you can navigate to the Simulink block that causes the result by clicking the Go To Model () button.
You can also navigate to the block corresponding to a Polyspace result right clicking the token in the source code on which the result is reported. Right-click the flagged token and select Go to Model.
Navigating back to model is possible for a subset of source code token and results that can be directly traced to a Simulink block. For more details on which tokens in generated code can be traced to Simulink blocks, see Trace Simulink Model Elements in Generated Code (Embedded Coder).
In addition to navigating to blocks corresponding to results, you can also navigate to Simulink blocks corresponding to a block of generated code. The generated code blocks contain links to the corresponding Simulink models. To see the blocks in the model, click the block names in the links. If you encounter issues, see Troubleshoot Navigation from Code to Model.
Fix Issue
Investigate whether the issues in your code are related to design flaws in the model.
Design flaws in the model can lead to issues in the generated code. For instance:
The generated code might be free of specific run-time errors only for a certain range of a block parameter. To fix this issue, you can change the storage class of that block parameter or use calibration data for the analysis by using the configuration parameter Tunable parameters.
The generated code might be free of specific run-time errors only for a certain range of inputs. To determine this range, you can specify a minimum and maximum value for the Inport block signals. The Polyspace analysis uses this constrained range. See Work with Signal Ranges in Blocks (Simulink).
Certain transitions in Stateflow® charts can be unreachable.
You might integrate the generated code with handwritten code. A Polyspace analysis can detect coding defects and coding rule violations stemming from the integration. If you include any handwritten code in your Simulink model, you can analyze the included handwritten code in isolation. See:
Annotate Blocks to Justify Issues
You might want to justify some Polyspace results without modifying the code or the model. Annotate Simulink blocks either from the Polyspace Platform user interface or the Simulink editor. See Address Polyspace Results by Annotating Simulink Blocks.