Multicore Simulation of Comparing Demodulation Types
This example compares an LLR and hard decision demodulation. It uses the dataflow domain in Simulink® to automatically partition the data-driven portions of the communications system into multiple threads and thereby improve the performance of the simulation by executing it on your desktop's multiple cores.
Introduction
Dataflow execution domain allows you to make use of multiple cores in the design of computationally intensive systems. This example shows how dataflow as the execution domain of a subsystem improves simulation performance of the model. To learn more about dataflow and how to run Simulink models using multiple threads, see Multicore Execution Using Dataflow Domain.
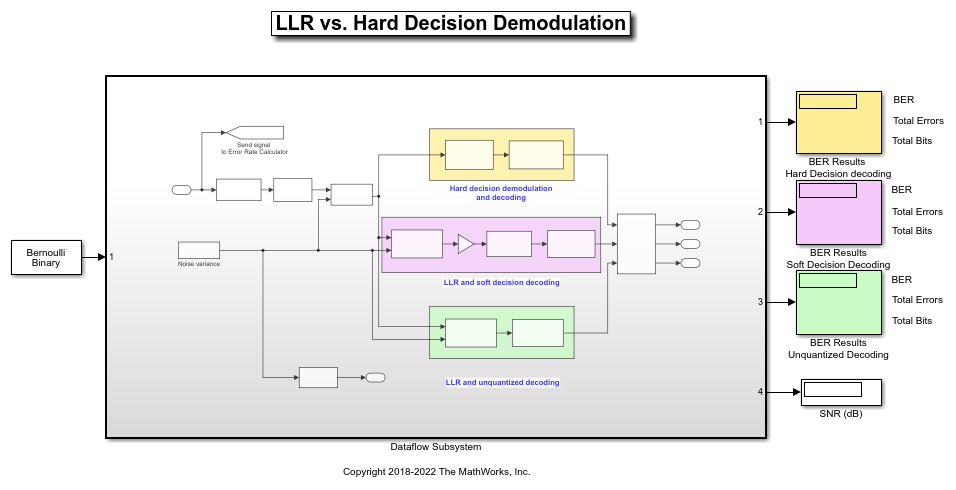
LLR vs Hard Decision Demodulation
This example shows a communication system that compares BER performance when using LLR instead of hard decision demodulation in the decoder. This example has one transmitter, an AWGN channel and three receivers. The three receivers use different decoding techniques to compare the BER of each approach. Bit error rate computation is shown in Display blocks for comparing the performance of the three receivers.
Setting up the Dataflow Subsystem
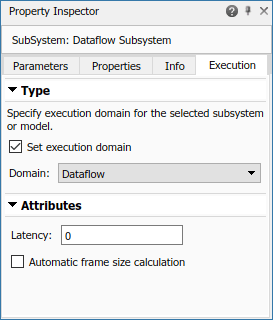
This example uses dataflow domain in Simulink to make use of multiple cores on your desktop to improve simulation performance. The Domain parameter of the dataflow subsystem in this model is set as Dataflow. You can view this by selecting the subsystem and then accessing Property Inspector. To access Property Inspector, in the Simulink Toolstrip, on the Modeling tab, in the Design gallery select Property Inspector or on the Simulation tab, Prepare gallery, select Property Inspector.
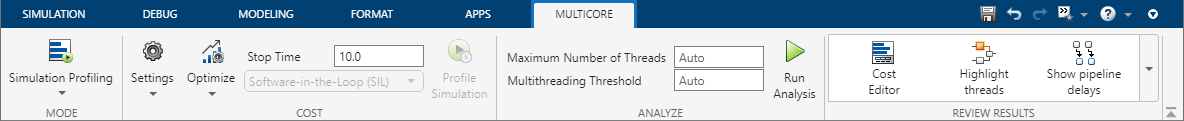
Dataflow domains automatically partition your model into multiple threads for better performance. Once you set the Domain parameter to Dataflow, you can use the Multicore tab analysis to analyze your model to get better performance. The Multicore tab is available in the toolstrip when there is a dataflow domain in the model. To learn more about the Multicore tab, see Perform Multicore Analysis for Dataflow.
Analyzing Concurrency in Dataflow Subsystem
For this example the Multicore tab mode is set to Simulation Profiling for simulation performance analysis.
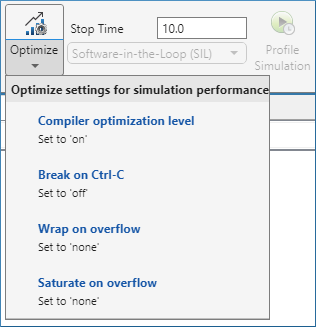
It is recommended to optimize model settings for optimal simulation performance. To accept the proposed model settings, on the Multicore tab, click Optimize. Alternatively, you can use the drop menu below the Optimize button to change the settings individually. In this example the model settings are already optimal.
On the Multicore tab, click the Run Analysis button to start the analysis of the dataflow domain for simulation performance. Once the analysis is finished, the Analysis Report and Suggestions window shows how many threads the dataflow subsystem uses during simulation.
After analyzing the model, the Analysis Report and Suggestions window shows 3 threads because the three different receiver types can run independently in parallel. When Latency is zero, dataflow can only use this inherent parallelism in the model. The three receivers are data dependent on one transmitter. This causes bottleneck since the transmitter needs to complete its processing before any receivers start processing. Without pipeline delays only the inherent parallelism in the model can be utilized to run dataflow subsystem using multiple threads. By pipelining the data dependent blocks, the dataflow subsystem can increase concurrency for higher data throughput. The Analysis Report and Suggestions window shows the recommended number of pipeline delays as Suggested for Increasing Concurrency. The suggested latency value is computed to give the best performance.
The following diagram shows the Analysis Report and Suggestions window where the suggested latency is 3 for the dataflow subsystem.
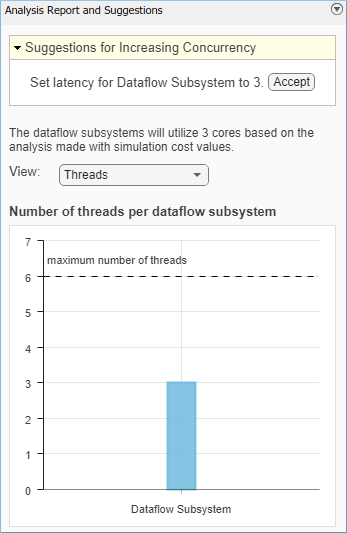
Click the Accept button to use the recommended latency for the dataflow subsystem. This value can also be entered directly in the Property Inspector for Latency parameter. Simulink shows the latency parameter value using  tags at the output ports of the dataflow subsystem.
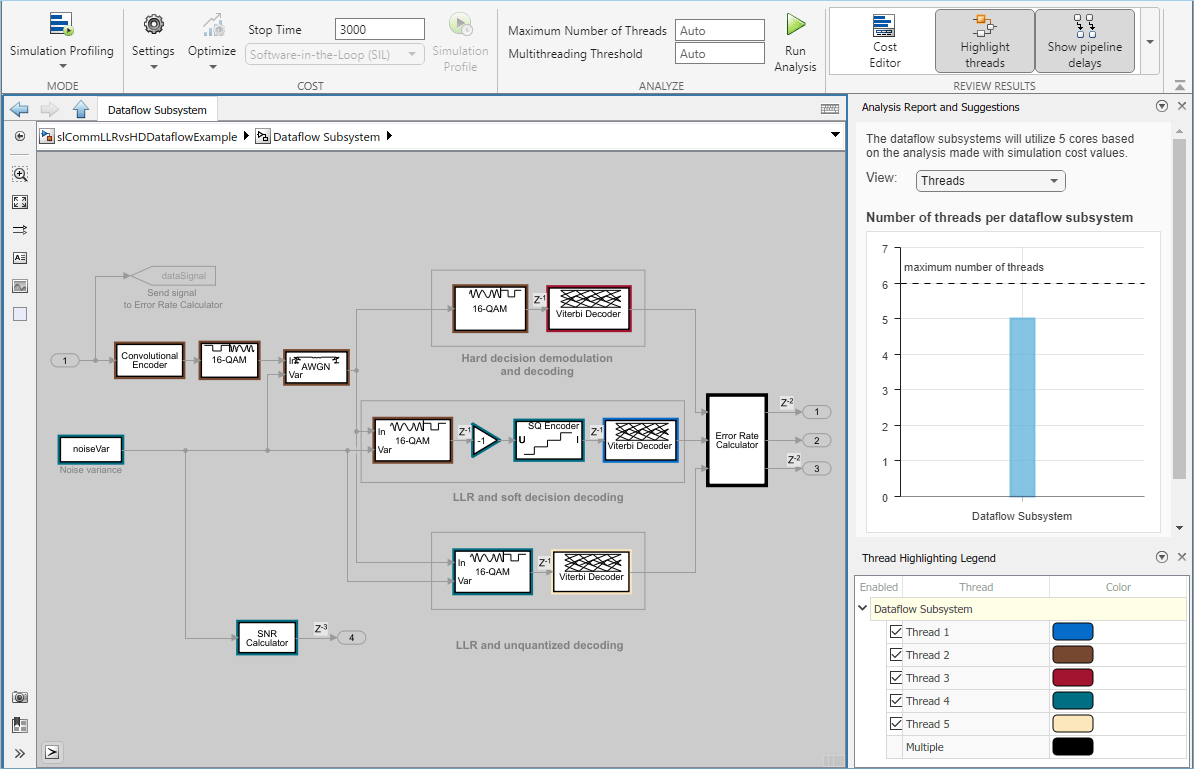
The Analysis Report and Suggestions window now shows the number of threads as 5 meaning that the blocks inside the dataflow subsystem simulate in parallel using 5 threads. Use of three pipeline delays increased the number of blocks that can be run in parallel inside the dataflow subsystem. Highlight threads highlights the blocks with colors based on their thread allocation as shown in the Thread Highlighting Legend. Show pipeline delays shows where pipelining delays were inserted within the dataflow subsystem using tags.
Multicore Simulation Performance
We measure the performance improvement of using multiple cores by comparing the execution time taken for running the model using multiple threads with the time taken when the model does not use dataflow. Execution time is measured using the sim command, which returns the simulation execution time of the model. These numbers and analysis were published on a Windows desktop computer with Intel® Xeon® CPU W-2133 @ 3.6 GHz 6 Cores 12 Threads processor.
Simulation execution time for multithreaded model = 4.26s
Simulation execution time for single-threaded model = 10.81s
Actual speedup with dataflow: 2.5x
Summary
This example shows how dataflow execution domain can improve performance in a communication system model using multiple cores on the desktop.