plotSpectrum
System object: phased.MUSICEstimator
Namespace: phased
Plot MUSIC spectrum
Syntax
plotSpectrum(estimator)

output_args = plotSpectrum(estimator,Name=Value)

lh = plotSpectrum(___)
Description
plotSpectrum( plots the MUSIC spectrum
computed by the most recent execution of the estimator)phased.MUSICEstimator
System object™, estimator.
output_args = plotSpectrum(estimator,Name=Value)Name=Value pair arguments.
lh = plotSpectrum(___) returns
the line handle to the figure.
Input Arguments
Name-Value Arguments
Output Arguments
Examples
Estimate the DOAs of two signals received by a standard 10-element ULA having an element spacing of 1 meter. Then plot the MUSIC spectrum.
Create a ULA array object. The antenna operating frequency is 150 MHz.
fc = 150.0e6;
array = phased.ULA(NumElements=10,ElementSpacing=1.0);
Create the arriving signals at the ULA. The true direction of arrival of the first signal is 10° in azimuth and 20° in elevation. The direction of the second signal is 60° in azimuth and -5° in elevation.
fs = 8000.0;
t = (0:1/fs:1).';
sig1 = cos(2*pi*t*300.0);
sig2 = cos(2*pi*t*400.0);
sig = collectPlaneWave(array,[sig1 sig2],[10 20; 60 -5]',fc);
noise = 0.1*(randn(size(sig)) + 1i*randn(size(sig)));
Estimate the DOAs.
estimator = phased.MUSICEstimator(SensorArray=array,...
    OperatingFrequency=fc,...
    DOAOutputPort=true,NumSignalsSource="Property",...
    NumSignals=2);
[y,doas] = estimator(sig + noise);
doas = broadside2az(sort(doas),[20 -5])
doas = 1×2

    9.5829   60.3813
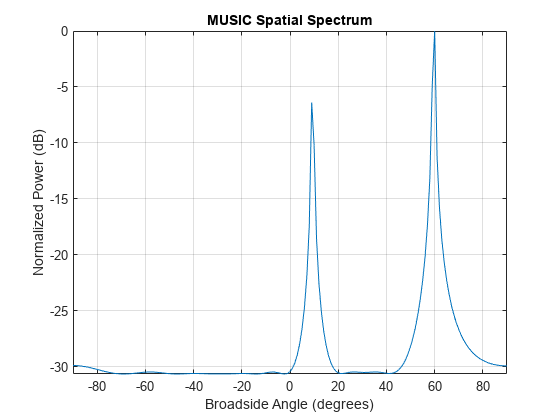
Plot the MUSIC spectrum.
plotSpectrum(estimator,NormalizeResponse=true)
Version History
Introduced in R2016b