Guide Code Sanitizer Using Polyspace Code Prover Results
R2026bPolyspace® Code Prover™ runs static analysis to exhaustively prove the absence of specific run-time errors in your code. Proven or possible errors found during static analysis are displayed as red or orange checks. When reviewing these checks, you can supplement your review with run-time information by running existing tests using the guided sanitizer in Polyspace Test™.
This tutorial illustrates how to combine the exhaustive proof provided by Polyspace Code Prover with the dynamic testing capabilities of Polyspace Test.
Overview
Using the guided sanitizer in Polyspace Test helps you identify real issues in red or orange checks from Polyspace Code Prover.
Static analysis using Code Prover can consider more execution paths or inputs than what can occur at run time. If an issue identified in static analysis is hit during execution of your tests, it confirms that the execution paths or inputs can occur in practice. For instance:
Code Prover displays an orange check after static analysis when it cannot prove the presence or absence of a run-time error. If the orange check is hit during test execution, it confirms that the run-time error can occur in practice.
Code Prover displays a red check to indicate code with definite run-time errors provided the code is reachable. If a red check is hit during test execution, it confirms that the code is reachable at run time.
When you guide the Polyspace Test code sanitizer using Code Prover results, it also reduces instrumentation overhead compared to the unguided mode by focusing only on the expressions flagged by Code Prover. However, note that in the guided mode, the sanitizer does not detect memory leaks.
Example Files
This tutorial uses the files in the folder polyspaceroot\polyspace\examples\doc_pstest\guided_sanitizerpolyspacerootC:\Program Files\Polyspace\R2026b.
The folder contains the following two files:
src\src.c— A data processing module that contains multiple functions with potential run-time errors, including integer overflows, division by zero, out-of-bounds array access, and illegally dereferenced pointers.test\test.c— A set of xUnit tests authored using the Polyspace Test xUnit-based API. Each test exercises one or more of the functions insrc.cwith inputs that trigger specific run-time errors.
To continue with this tutorial:
Create a new Polyspace Platform project.
On the Polyspace Platform toolstrip, select
 and add the file
 src.cfrom thesrcsubfolder to the project.On the toolstrip, select Import Tests > Add Polyspace xUnit Test Files and add the file
test.cfrom thetestsubfolder to the project as an xUnit test file.
Run Code Prover
Run a Polyspace Code Prover analysis on the source code to identify possible run-time errors.
On the toolstrip, select Prove Absence of Run-Time Errors (this option exists in the same menu as Find Issues).
Follow the progress of analysis on the Polyspace | Run-Time Errors pane.
After analysis, on the Results pane, you see a Run-Time Errors node for the Code Prover results. Right-click this node and select Open Review to open the full list of results.
For more information on running Code Prover in the user interface, see Run Static Analysis in Polyspace Platform User Interface (Polyspace Code Prover).
Review Code Prover Results
In the Review perspective, the Results List pane shows the Code Prover results as a list of colored run-time checks. The results include several orange checks, which indicate possible run-time errors that Code Prover could not fully resolve.
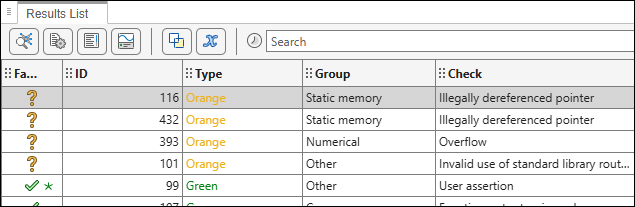
For instance, enter get_scaled_value in the search box on this pane and select the remaining Illegally dereferenced pointer orange check. On the Source Code pane, you see that the check is on the expression config->buffer[index] in the function get_scaled_value(). Code Prover flags this expression because the pointer config->buffer might be dereferenced with an
out-of-bounds index.
![Source code view showing the get_scaled_value function with the expression config->buffer[index] highlighted as an orange Illegally dereferenced pointer check.](source_code_codeprover.png)
An orange check means that Code Prover found a possible error but could not determine whether it actually occurs at run time. You can use guided sanitizer profiling to determine if the error actually occurs during execution of the tests in the project.
Configure Guided Sanitizer
Configure the sanitizer to use the Code Prover results file so that instrumentation is focused on the expressions that Code Prover reported as red or orange checks.
Select Project to go back to the Project perspective.
On the Results pane, right-click the Run-Time Errors node and select Show in Explorer to open the folder containing the results. You will have to provide the path to the result in a later step.
Open the project configuration and select Testing and Profiling. On the Sanitizer node, pick Select from results file. See also
Select from results file.In the Code Prover results file field, enter or browse to the path of the Code Prover results file (
.pscp) generated in the previous step. See alsoCode Prover results file.
When you provide a Code Prover results file, the sanitizer instruments only those expressions where Code Prover found definite or possible errors (red or orange checks). If an orange check is hit during test execution, it confirms that the issue is a real run-time error. In addition, this guided approach reduces instrumentation overhead compared to a full sanitizer run.
Run Sanitizer
Build and run the tests with sanitizer profiling enabled to determine which orange checks from Code Prover correspond to actual run-time errors during test execution.
On the Polyspace Platform toolstrip, change the profiling mode from No profiling to Sanitizer.
Build the project and run tests as usual. For more information, see Build and Run Tests in Polyspace Platform User Interface.
After running tests, on the Results pane, you see a Sanitizer Profiling node. Right-click this node and select Open Review to open the sanitizer profiling results.
Review Sanitizer Results
The sanitizer profiling results show whether the possible errors identified by Code Prover actually occur during test execution. On the Results List pane, you see the instrumented expressions organized by file and function, with a result status indicating whether a defect was detected for each expression.
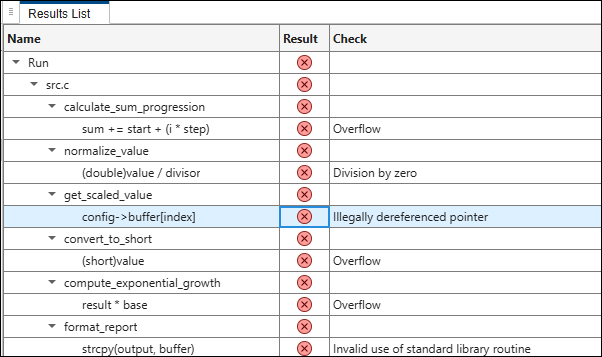
For instance, select the config->buffer[index] expression in the function get_scaled_value(). This is the same expression that Code Prover flagged as an orange Illegally dereferenced pointer check. On the Source Code pane, you see the expression highlighted, confirming that the sanitizer detected a defect at this location during test execution.
![Source code view in the sanitizer profiling review showing the expression config->buffer[index] highlighted as a detected defect in the get_scaled_value function.](source_code_sanitizer.png)
This result confirms that the possible run-time error identified by Code Prover (the orange check) actually occurs in practice during test execution. The guided sanitizer profiling helps you validate Code Prover findings by showing you which statically detected issues are triggered by your tests, enabling you to prioritize fixes for issues.
See Also
Select from results file | Code Prover results file

