bearingFaultBands
Generate frequency bands around the characteristic fault frequencies of ball or roller bearings for spectral feature extraction
Syntax
Description
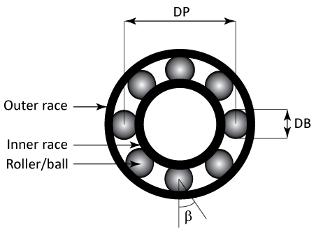
FB = bearingFaultBands(FR,NB,DB,DP,beta)FB of a roller or ball
bearing using its physical parameters. FR is the rotational speed of
the shaft or inner race, NB is the number of balls or rollers,
DB is the ball or roller diameter, DP is the
pitch diameter, and beta is the contact angle in degrees. The values
in FB have the same implicit units as FR.
Examples
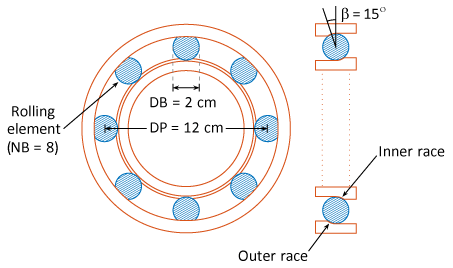
For this example, consider a bearing with a pitch diameter of 12 cm with eight rolling elements. Each rolling element has a diameter of 2 cm. The outer race remains stationary as the inner race is driven at 25 Hz. The contact angle of the rolling element is 15 degrees.

With the above physical dimensions of the bearing, construct the frequency bands using bearingFaultBands.
FR = 25;
NB = 8;
DB = 2;
DP = 12;
beta = 15;
FB = bearingFaultBands(FR,NB,DB,DP,beta)
FB = 4×2

   82.6512   85.1512
  114.8488  117.3488
   71.8062   74.3062
    9.2377   11.7377
FB is returned as a 4x2 array with default frequency band width of 10 percent of FR which is 2.5 Hz. The first column in FB contains the values of , while the second column contains all the values of for each characteristic defect frequency.
For this example, consider a micro roller bearing with 11 rollers where each roller is 7.5 mm. The pitch diameter is 34 mm and the contact angle is 0 degrees. Assuming a shaft speed of 1800 rpm, construct frequency bands for the roller bearing. Specify 'Domain' as 'frequency' to obtain the frequency bands FB in the same units as FR.
FR = 1800;
NB = 11;
DB = 7.5;
DP = 34;
beta = 0;
[FB1,info1] = bearingFaultBands(FR,NB,DB,DP,beta,'Domain','frequency')
FB1 = 4×2
104 ×

    0.7626    0.7806
    1.1994    1.2174
    0.3791    0.3971
    0.0611    0.0791
info1 = struct with fields:
        Centers: [7.7162e+03 1.2084e+04 3.8815e+03 701.4706]
    FaultGroups: [1 2 3 4]
         Labels: {'1Fo'  '1Fi'  '1Fb'  '1Fc'}
Now, include the sidebands for the inner race and rolling element defect frequencies using the 'Sidebands' name-value pair.
[FB2,info2] = bearingFaultBands(FR,NB,DB,DP,beta,'Domain','order','Sidebands',0:1)
FB2 = 8×2

    4.2368    4.3368
    5.6632    5.7632
    6.6632    6.7632
    7.6632    7.7632
    1.7167    1.8167
    2.1064    2.2064
    2.4961    2.5961
    0.3397    0.4397
info2 = struct with fields:
        Centers: [4.2868 5.7132 6.7132 7.7132 1.7667 2.1564 2.5461 0.3897]
    FaultGroups: [1 2 2 2 3 3 3 4]
         Labels: {'1Fo'  '1Fi-1Fr'  '1Fi'  '1Fi+1Fr'  '1Fb-1Fc'  '1Fb'  '1Fb+1Fc'  '1Fc'}
You can use the generated fault bands FB to extract spectral metrics using the faultBandMetrics command.
For this example, consider a damaged bearing with a pitch diameter of 12 cm with eight rolling elements. Each rolling element has a diameter of 2 cm. The outer race remains stationary as the inner race is driven at 25 Hz. The contact angle of the rolling element is 15 degrees.
With the above physical dimensions of the bearing, visualize the fault frequency bands using bearingFaultBands.
FR = 25;
NB = 8;
DB = 2;
DP = 12;
beta = 15;
bearingFaultBands(FR,NB,DB,DP,beta)
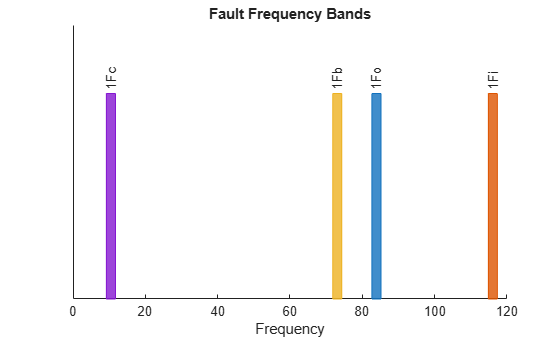
From the plot, observe the following bearing specific vibration frequencies:
Cage defect frequency,
Fcat 10.5 Hz.Ball defect frequency,
Fbat 73 Hz.Outer race defect frequency,
Foat 83.9 Hz.Inner race defect frequency,
Fiat 116.1 Hz.
For this example, consider a ball bearing with a pitch diameter of 12 cm with 10 rolling elements. Each rolling element has a diameter of 0.5 cm. The outer race remains stationary as the inner race is driven at 25 Hz. The contact angle of the ball is 0 degrees. The data set bearingData.mat contains power spectral density (PSD) and its respective frequency data for the bearing vibration signal in a table.
First, construct the bearing frequency bands including the first 3 sidebands using the physical characteristics of the ball bearing.
FR = 25;
NB = 10;
DB = 0.5;
DP = 12;
beta = 0;
FB = bearingFaultBands(FR,NB,DB,DP,beta,'Sidebands',1:3)
FB = 14×2
118.5417 121.0417
53.9583 56.4583
78.9583 81.4583
103.9583 106.4583
153.9583 156.4583
178.9583 181.4583
203.9583 206.4583
262.2917 264.7917
274.2708 276.7708
286.2500 288.7500
310.2083 312.7083
322.1875 324.6875
334.1667 336.6667
10.7292 13.2292
FB is a 14x2 array which includes the primary frequencies and their sidebands.
Load the PSD data. bearingData.mat contains a table X where PSD is contained in the first column and the frequency grid is in the second column, as cell arrays respectively.
load('bearingData.mat','X')
X
X=1×2 table
          Var1                Var2
    ________________    ________________

    {12001×1 double}    {12001×1 double}
Compute the spectral metrics using the PSD data in table X and the frequency bands in FB.
spectralMetrics = faultBandMetrics(X,FB)
spectralMetrics=1×43 table
    PeakAmplitude1    PeakFrequency1    BandPower1    PeakAmplitude2    PeakFrequency2    BandPower2    PeakAmplitude3    PeakFrequency3    BandPower3    PeakAmplitude4    PeakFrequency4    BandPower4    PeakAmplitude5    PeakFrequency5    BandPower5    PeakAmplitude6    PeakFrequency6    BandPower6    PeakAmplitude7    PeakFrequency7    BandPower7    PeakAmplitude8    PeakFrequency8    BandPower8    PeakAmplitude9    PeakFrequency9    BandPower9    PeakAmplitude10    PeakFrequency10    BandPower10    PeakAmplitude11    PeakFrequency11    BandPower11    PeakAmplitude12    PeakFrequency12    BandPower12    PeakAmplitude13    PeakFrequency13    BandPower13    PeakAmplitude14    PeakFrequency14    BandPower14    TotalBandPower
    ______________    ______________    __________    ______________    ______________    __________    ______________    ______________    __________    ______________    ______________    __________    ______________    ______________    __________    ______________    ______________    __________    ______________    ______________    __________    ______________    ______________    __________    ______________    ______________    __________    _______________    _______________    ___________    _______________    _______________    ___________    _______________    _______________    ___________    _______________    _______________    ___________    _______________    _______________    ___________    ______________

         121               121            314.43          56.438            56.438          144.95          81.438            81.438          210.57          106.44            106.44          276.2           156.44            156.44          407.45          181.44            181.44          473.07          206.44            206.44          538.7           264.75            264.75          691.77          276.75            276.75          723.27          288.69             288.69           754.61           312.69             312.69           817.61           324.62             324.62           848.94           336.62             336.62           880.44           13.188             13.188           31.418           7113.4
spectralMetrics is a 1x43 table with peak amplitude, peak frequency and band power calculated for each frequency range in FB. The last column in spectralMetrics is the total band power, computed across all 14 frequencies in FB.
Input Arguments
Name-Value Arguments
Output Arguments
Algorithms
bearingFaultBands computes the different characteristic bearing
frequencies as follows:
Outer race defect frequency,
Inner race defect frequency,
Rolling element (ball) defect frequency,
Cage (train) defect frequency,
References
[1] Chandravanshi, M & Poddar, Surojit. "Ball Bearing Fault Detection Using Vibration Parameters." International Journal of Engineering Research & Technology. 2. 2013.
[2] Singh, Sukhjeet & Kumar, Amit & Kumar, Navin. "Motor Current Signature Analysis for Bearing Fault Detection in Mechanical Systems." Procedia Materials Science. 6. 171–177. 10.1016/j.mspro.2014.07.021. 2014.
[3] Roque, Antonio & Silva, Tiago & Calado, João & Dias, J. "An approach to fault diagnosis of rolling bearings." WSEAS Transactions on Systems and Control. 4. 2009.
Version History
Introduced in R2019b