Main Content

ClutterRegionPlotter

Clutter region plotter object belonging to theater plot

Since R2022b

Description

ClutterRegionPlotter is a clutter region plotter object belonging to a theaterPlot object. Use the plotClutterRegion function to plot clutter from the ClutterRegionPlotter object.

Creation

Create a ClutterRegionPlotter objects using the clutterRegionPlotter object function of the theaterPlot object.

Properties

expand all

Plot name to display in legend, specified as a character vector or string. If you do not specify this argument, the function does not display a plot name.

Tag associated with the plotter, specified as a character vector or string. You can use the findPlotter function to identify plotters based on their tag. The default value is 'PlotterN', where N is an integer that corresponds to the Nth plotter associated with the theaterPlot.

Face alpha value for plotted regions, specified as a scalar in the range [0 1]. The same value is applied to all regions.

Face color value for all plotted regions, specified as a color string or [R,G,B] vector.

The edge alpha value of the region edges, specified as a scalar. The same alpha value is used for all regions.

Edge color for all regions, specified as a character vector of a valid color, a string scalar of a valid color, an RGB triplet, or a hexadecimal color code.

Marker symbol for patches, specified as a char.

ocirclessquare^triangle (up)
xx-markddiamondvtriangle (down)
+plusppentagram<triangle (left)
*starhhexagram>triangle (right)
.dot    

Patch marker fill color, specified as a color string or an [R, G, B] vector defining a color.

Example: [.1,.1,.1]

Patch marker edge color, specified as a color string or an [R, G, B] vector defining a color.

Example: [.1,.5,.4]

Size of patch marker, specified as a positive integer.

Show patch centers, specified as false or true.

Maximum number of clutter patches to plot, specified as a scalar.

Example: 3

Examples

collapse all

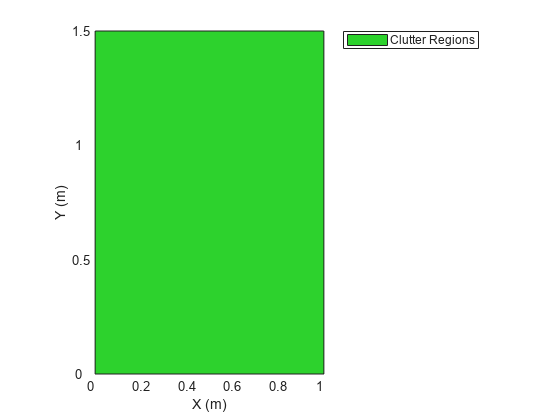
Create a clutterRegionPlotter object from a theaterPlot object. Fill a clutter region data structure plotdata and then plot the region.

tp = theaterPlot;
clutrregion = clutterRegionPlotter(tp,'DisplayName','Clutter Regions');
plotdata = struct('X',[0 1 1 0],'Y',[0 0 1.5 1.5],'RegionPlotHeight',25)
plotdata = struct with fields:
                   X: [0 1 1 0]
                   Y: [0 0 1.5000 1.5000]
    RegionPlotHeight: 25

plotClutterRegion(clutrregion,plotdata);

Figure contains an axes object. The axes object with xlabel X (m), ylabel Y (m) contains an object of type patch. This object represents Clutter Regions.

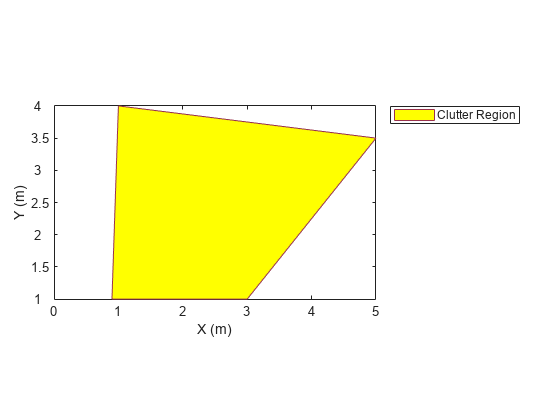
Create a quadrilateral clutterRegionPlotter object from a theaterPlot object. Set the clutter region data structure plotdata and then plot the region. Set an edge color and a face color.

Choose the four vertices of the quadrilateral. Set the region plot height to 25 m.

p1 = [1 4];
p2 = [5 3.5];
p3 = [3 1];
p4 = [0.9 1];
X = [p1(1) p2(1) p3(1) p4(1)];
Y = [p1(2) p2(2) p3(2) p4(2)];
tp = theaterPlot;
clutrregion = clutterRegionPlotter(tp,'DisplayName', ...
    'Clutter Region','RegionFaceColor','y', ...
    'RegionEdgeColor',[.6 .2 .3]);
plotdata = struct('X',X,'Y',Y,'RegionPlotHeight',25)
plotdata = struct with fields:
                   X: [1 5 3 0.9000]
                   Y: [4 3.5000 1 1]
    RegionPlotHeight: 25

plotClutterRegion(clutrregion,plotdata);

Figure contains an axes object. The axes object with xlabel X (m), ylabel Y (m) contains an object of type patch. This object represents Clutter Region.

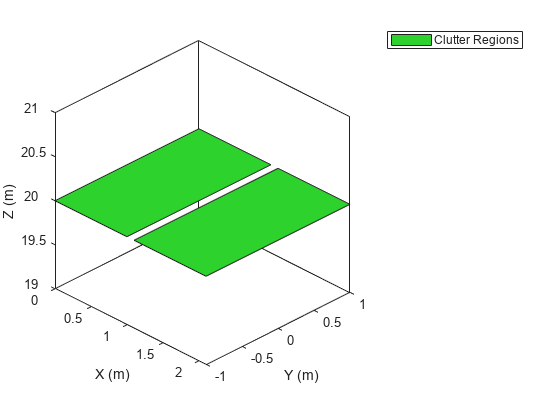
Create two clutter adjacent regions.

tp = theaterPlot;
clutp = clutterRegionPlotter(tp,'DisplayName','Clutter Regions');
pd = struct('X',[0 1.1; 1 2.1; 1 2.1; 0 1.1],'Y', ...
    [-1 -1; -1 -1;1 1; 1 1],'RegionPlotHeight',20);
plotClutterRegion(clutp,pd);
view(45,30)

Figure contains an axes object. The axes object with xlabel X (m), ylabel Y (m) contains an object of type patch. This object represents Clutter Regions.

Version History

Introduced in R2022b