plotClutterRegion
Description
plotClutterRegion(
uses the clutter region plotter
,plotterData
)plotter
to display clutter regions specified by
the data plotterData
.
Examples
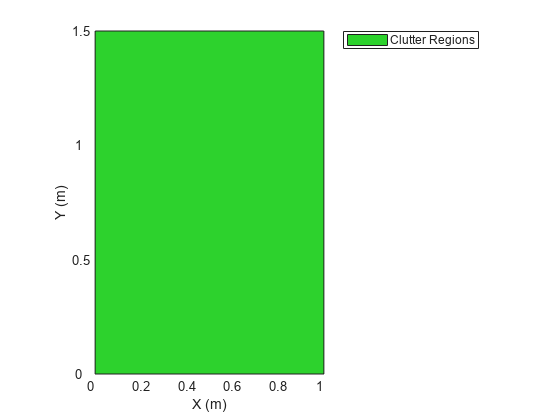
Create a clutterRegionPlotter
object from a theaterPlot
object. Fill a clutter region data structure plotdata
and then plot the region.
tp = theaterPlot; clutrregion = clutterRegionPlotter(tp,'DisplayName','Clutter Regions'); plotdata = struct('X',[0 1 1 0],'Y',[0 0 1.5 1.5],'RegionPlotHeight',25)
plotdata = struct with fields:
X: [0 1 1 0]
Y: [0 0 1.5000 1.5000]
RegionPlotHeight: 25
plotClutterRegion(clutrregion,plotdata);
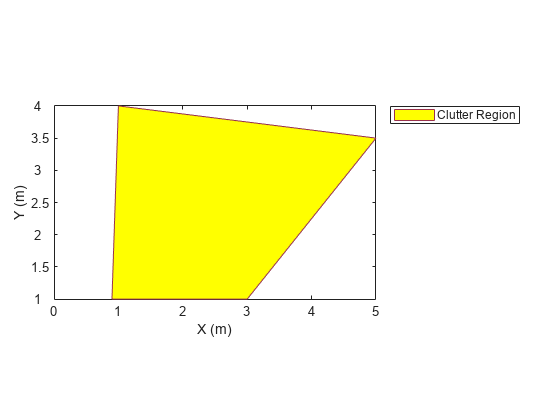
Create a quadrilateral clutterRegionPlotter
object from a theaterPlot
object. Set the clutter region data structure plotdata
and then plot the region. Set an edge color and a face color.
Choose the four vertices of the quadrilateral. Set the region plot height to 25 m.
p1 = [1 4]; p2 = [5 3.5]; p3 = [3 1]; p4 = [0.9 1]; X = [p1(1) p2(1) p3(1) p4(1)]; Y = [p1(2) p2(2) p3(2) p4(2)]; tp = theaterPlot; clutrregion = clutterRegionPlotter(tp,'DisplayName', ... 'Clutter Region','RegionFaceColor','y', ... 'RegionEdgeColor',[.6 .2 .3]); plotdata = struct('X',X,'Y',Y,'RegionPlotHeight',25)
plotdata = struct with fields:
X: [1 5 3 0.9000]
Y: [4 3.5000 1 1]
RegionPlotHeight: 25
plotClutterRegion(clutrregion,plotdata);
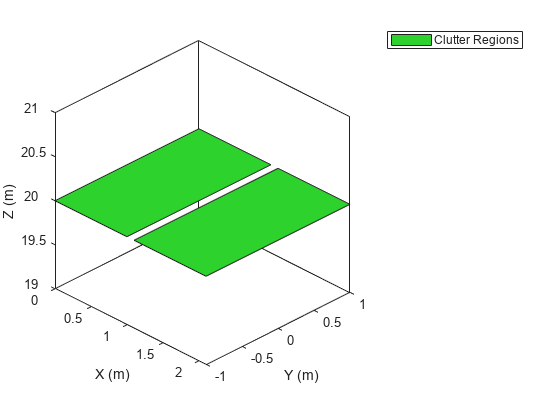
Create two clutter adjacent regions.
tp = theaterPlot; clutp = clutterRegionPlotter(tp,'DisplayName','Clutter Regions'); pd = struct('X',[0 1.1; 1 2.1; 1 2.1; 0 1.1],'Y', ... [-1 -1; -1 -1;1 1; 1 1],'RegionPlotHeight',20); plotClutterRegion(clutp,pd); view(45,30)
Input Arguments
ClutterRegionPlotter
object, created by the clutterRegionPlotter
function.
Plot data, specified as a structure. You can directly create this argument by using
the clutterRegionData
function. To create this argument manually, specify each
structure with these fields.
Field Name | Description |
---|---|
X | x-coordinates of region specified as a M-by-N matrix. Each column contains the x-coordinates of a different clutter region. N is the number of clutter regions. |
Y | y-coordinates of region specified as a M-by-N matrix. Each column contains the y-coordinates of a different clutter region. N is the number of clutter regions. |
RegionPlotHeight | Height of the clutter region, specified as a scalar. The same height applies to all regions. |
PatchCenters | Patch centers, specified as a 3-by-N matrix where each column is a patch center position in scenario coordinates. |
Version History
Introduced in R2022b
MATLAB Command
You clicked a link that corresponds to this MATLAB command:
Run the command by entering it in the MATLAB Command Window. Web browsers do not support MATLAB commands.
Seleccione un país/idioma
Seleccione un país/idioma para obtener contenido traducido, si está disponible, y ver eventos y ofertas de productos y servicios locales. Según su ubicación geográfica, recomendamos que seleccione: .
También puede seleccionar uno de estos países/idiomas:
Cómo obtener el mejor rendimiento
Seleccione China (en idioma chino o inglés) para obtener el mejor rendimiento. Los sitios web de otros países no están optimizados para ser accedidos desde su ubicación geográfica.
América
- América Latina (Español)
- Canada (English)
- United States (English)
Europa
- Belgium (English)
- Denmark (English)
- Deutschland (Deutsch)
- España (Español)
- Finland (English)
- France (Français)
- Ireland (English)
- Italia (Italiano)
- Luxembourg (English)
- Netherlands (English)
- Norway (English)
- Österreich (Deutsch)
- Portugal (English)
- Sweden (English)
- Switzerland
- United Kingdom (English)