Hyperlink Image
This example shows how to define areas in an image as hyperlinks. You can define hyperlinks so that they link to a target web page or navigate to another location in the same report.
Import the DOM and Report API packages so you do not have to use long, fully qualified class names.
import mlreportgen.dom.*
import mlreportgen.report.*
Create and open a report.
% To create an HTML report, change "pdf” to “html” or "html-file" for a
% multifile or single-file report, respectively.
rpt = Report("myreport","pdf");
open(rpt);
Add a paragraph to the report.
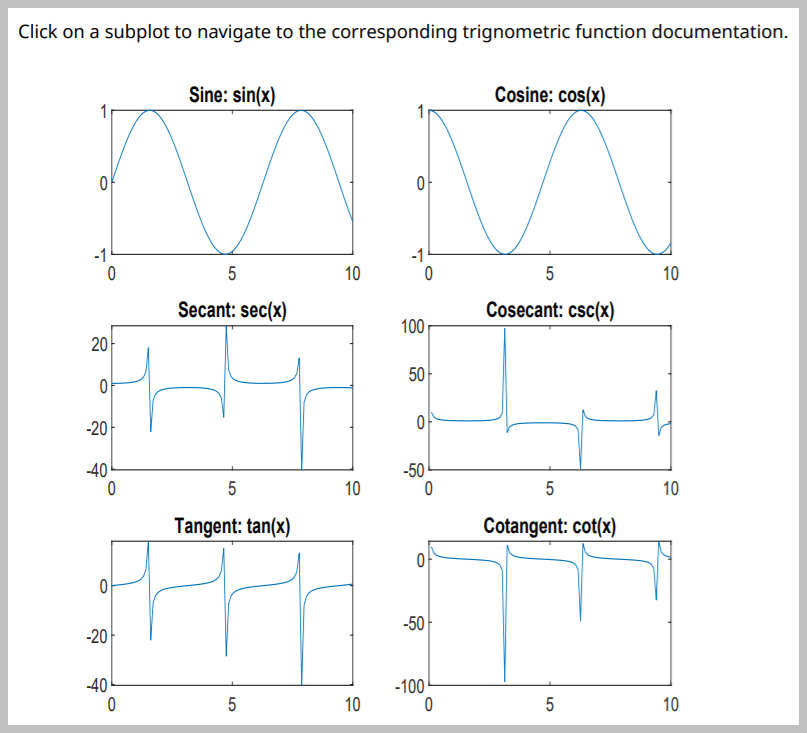
content = "Click on a subplot to navigate to the corresponding " + ...
    "trigonometric function documentation.";
add(rpt,Paragraph(content));
Create a figure with multiple subplots for different trigonometric functions.
figH = figure;
x = linspace(0,10);

sinePlot = subplot(3,2,1,"Units","pixels");
plot(x,sin(x));
title("Sine: sin(x)");

cosinePlot = subplot(3,2,2,"Units","pixels");
plot(x,cos(x));
title("Cosine: cos(x)");

secantPlot = subplot(3,2,3,"Units","pixels");
plot(x,sec(x));
title("Secant: sec(x)");

cosecantPlot = subplot(3,2,4,"Units","pixels");
plot(x,csc(x));
title("Cosecant: csc(x)");

tangentPlot = subplot(3,2,5,"Units","pixels");
plot(x,tan(x));
title("Tangent: tan(x)");

cotangentPlot = subplot(3,2,6,"Units","pixels");
plot(x,cot(x));
title("Cotangent: cot(x)");
Use the Figure reporter to get the figure snapshot. Use the DOM Image to include the snapshot in the report.
figReporter = Figure("Source",figH,"SnapshotFormat","jpg");
imgPath = getSnapshotImage(figReporter,rpt);

figImg = Image(imgPath);
Create an image map on the snapshot with an image area for each subplot. The getCoords function, defined at the end of this example, obtains the coordinates of each subplot. The target for a subplot image area is set to be the documentation web page for the trigonometric function that is used to create that subplot. Then, add the snapshot to the report.
map = ImageMap;

sinePlotCoords = getCoords(sinePlot);
sinePlotArea = ImageArea("https://www.mathworks.com/help/matlab/ref/sin.html", ...
    "Sine",sinePlotCoords);
append(map,sinePlotArea);

cosinePlotCoords = getCoords(cosinePlot);
cosinePlotArea = ImageArea("https://www.mathworks.com/help/matlab/ref/cos.html", ...
    "Cosine",cosinePlotCoords);
append(map,cosinePlotArea);

secantPlotCoords = getCoords(secantPlot);
secantPlotArea = ImageArea("https://www.mathworks.com/help/matlab/ref/sec.html", ...
    "Secant",secantPlotCoords);
append(map,secantPlotArea);

cosecantPlotCoords = getCoords(cosecantPlot);
cosecantPlotArea = ImageArea("https://www.mathworks.com/help/matlab/ref/csc.html", ...
    "Cosecant",cosecantPlotCoords);
append(map,cosecantPlotArea);

tangentPlotCoords = getCoords(tangentPlot);
tangentPlotArea = ImageArea("https://www.mathworks.com/help/matlab/ref/tan.html", ...
    "Tangent",tangentPlotCoords);
append(map,tangentPlotArea);

cotangentPlotCoords = getCoords(cotangentPlot);
cotangentPlotArea = ImageArea("https://www.mathworks.com/help/matlab/ref/cot.html", ...
    "Cotangent",cotangentPlotCoords);
append(map,cotangentPlotArea);

figImg.Map = map;
add(rpt,figImg);
Delete the figure window. Close and view the report.
close(rpt);
delete(figH);
rptview(rpt);
The following function calculates and returns the top-left and bottom-right coordinates for the specified subplot in its parent figure. These coordinates are calculated by converting the subplot axes coordinates, which are based on the figure coordinate system, where its reference point is the bottom-left, to the DOM ImageArea coordinate system, where its reference point is the top-left of the image.
function coords = getCoords(subplot)
    subplotWidth = subplot.Position(3);
    subplotHeight = subplot.Position(4);

    fig = subplot.Parent;
    figHeight = fig.Position(4);

    x1 = subplot.Position(1);
    y1 = figHeight - (subplot.Position(2) + subplotHeight);

    x2 = x1 + subplotWidth;
    y2 = y1 + subplotHeight;

    coords = [x1, y1, x2, y2];
end