Main Content

La traducción de esta página aún no se ha actualizado a la versión más reciente. Haga clic aquí para ver la última versión en inglés.

Correlación cruzada con entrada multicanal

Genere tres secuencias exponenciales de 11 muestras dadas por 0.4n, 0.7n y 0.999n, con n0. Utilice stem3 para representar las secuencias una al lado de la otra.

N = 11;
n = (0:N-1)';

a = 0.4;
b = 0.7;
c = 0.999;

xabc = [a.^n b.^n c.^n];

stem3(n,1:3,xabc','filled')
ax = gca;
ax.YTick = 1:3;
view(37.5,30)

Figure contains an axes object. The axes object contains an object of type stem.

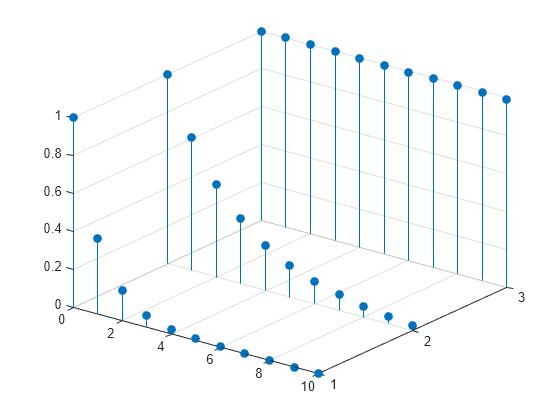
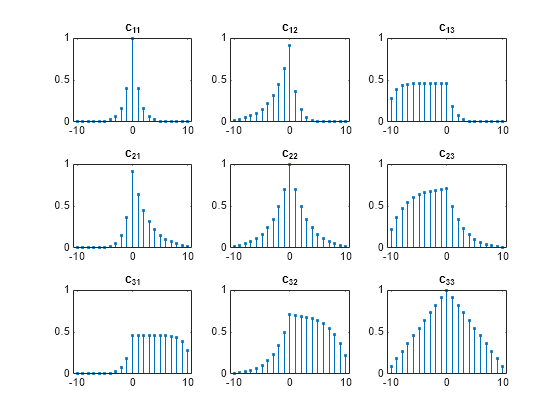
Calcule las autocorrelaciones y las correlaciones cruzadas mutuas de las secuencias. Obtenga los desfases como salida para no tener que hacer un seguimiento de ellos. Normalice el resultado para que las autocorrelaciones tengan valor unitario en el desfase cero.

[cr,lgs] = xcorr(xabc,'coeff');

for row = 1:3
    for col = 1:3
        nm = 3*(row-1)+col;
        subplot(3,3,nm)
        stem(lgs,cr(:,nm),'.')
        title(sprintf('c_{%d%d}',row,col))
        ylim([0 1])
    end
end

Figure contains 9 axes objects. Axes object 1 with title c indexOf 11 baseline contains an object of type stem. Axes object 2 with title c indexOf 12 baseline contains an object of type stem. Axes object 3 with title c indexOf 13 baseline contains an object of type stem. Axes object 4 with title c indexOf 21 baseline contains an object of type stem. Axes object 5 with title c indexOf 22 baseline contains an object of type stem. Axes object 6 with title c indexOf 23 baseline contains an object of type stem. Axes object 7 with title c indexOf 31 baseline contains an object of type stem. Axes object 8 with title c indexOf 32 baseline contains an object of type stem. Axes object 9 with title c indexOf 33 baseline contains an object of type stem.

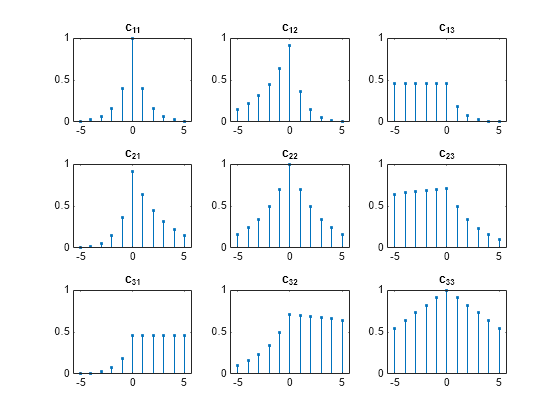
Restrinja el cálculo a los desfases entre -5 y 5.

[cr,lgs] = xcorr(xabc,5,'coeff');

for row = 1:3
    for col = 1:3
        nm = 3*(row-1)+col;
        subplot(3,3,nm)
        stem(lgs,cr(:,nm),'.')
        title(sprintf('c_{%d%d}',row,col))
        ylim([0 1])
    end
end

Figure contains 9 axes objects. Axes object 1 with title c indexOf 11 baseline contains an object of type stem. Axes object 2 with title c indexOf 12 baseline contains an object of type stem. Axes object 3 with title c indexOf 13 baseline contains an object of type stem. Axes object 4 with title c indexOf 21 baseline contains an object of type stem. Axes object 5 with title c indexOf 22 baseline contains an object of type stem. Axes object 6 with title c indexOf 23 baseline contains an object of type stem. Axes object 7 with title c indexOf 31 baseline contains an object of type stem. Axes object 8 with title c indexOf 32 baseline contains an object of type stem. Axes object 9 with title c indexOf 33 baseline contains an object of type stem.

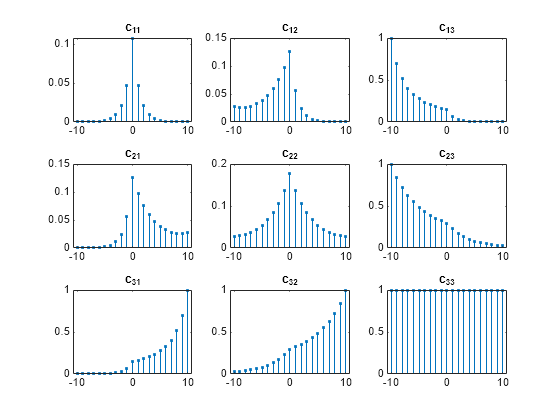
Calcule las estimaciones sin sesgo de las autocorrelaciones y las correlaciones cruzadas mutuas. De forma predeterminada, los desfases se ejecutan entre -(N-1) y N-1.

cu = xcorr(xabc,'unbiased');

for row = 1:3
    for col = 1:3
        nm = 3*(row-1)+col;
        subplot(3,3,nm)
        stem(-(N-1):(N-1),cu(:,nm),'.')
        title(sprintf('c_{%d%d}',row,col))
    end
end

Figure contains 9 axes objects. Axes object 1 with title c indexOf 11 baseline contains an object of type stem. Axes object 2 with title c indexOf 12 baseline contains an object of type stem. Axes object 3 with title c indexOf 13 baseline contains an object of type stem. Axes object 4 with title c indexOf 21 baseline contains an object of type stem. Axes object 5 with title c indexOf 22 baseline contains an object of type stem. Axes object 6 with title c indexOf 23 baseline contains an object of type stem. Axes object 7 with title c indexOf 31 baseline contains an object of type stem. Axes object 8 with title c indexOf 32 baseline contains an object of type stem. Axes object 9 with title c indexOf 33 baseline contains an object of type stem.

Consulte también

Funciones