Simular un sistema de muestreo y retención
Este ejemplo muestra varias formas de simular la salida de un sistema de muestreo y retención sobremuestreando y filtrando una señal.
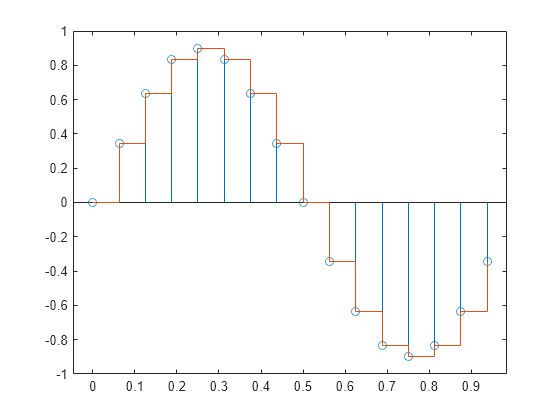
Construya una señal sinusoidal. Especifique una tasa de muestreo en la que 16 muestras se corresponden exactamente con un periodo de señal. Dibuje una gráfica de tallos y hojas de la señal. Superponga una gráfica de escaleras para visualizar el muestreo y retención.
fs = 16;
t = 0:1/fs:1-1/fs;

x = .9*sin(2*pi*t);

stem(t,x)
hold on
stairs(t,x)
hold off

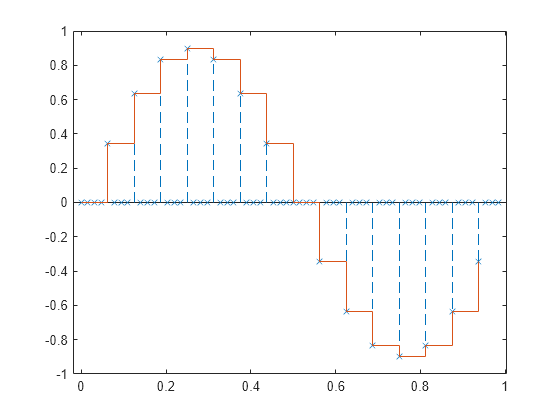
Sobremuestree la señal por un factor de cuatro. Represente el resultado junto con la señal original. upsample aumenta la tasa de muestreo de la señal añadiendo ceros entre las muestras existentes.
ups = 4;

fu = fs*ups;
tu = 0:1/fu:1-1/fu;

y = upsample(x,ups);

stem(tu,y,'--x')

hold on
stairs(t,x)
hold off

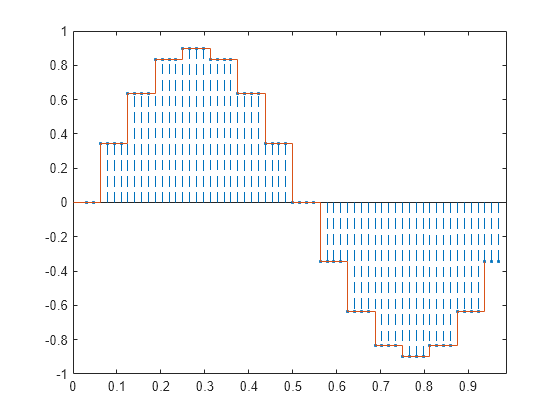
Filtre con un filtro FIR de media móvil para rellenar los ceros con valores de muestreo y retención.
h = ones(ups,1);

z = filter(h,1,y);

stem(tu,z,'--.')
hold on
stairs(t,x)
hold off

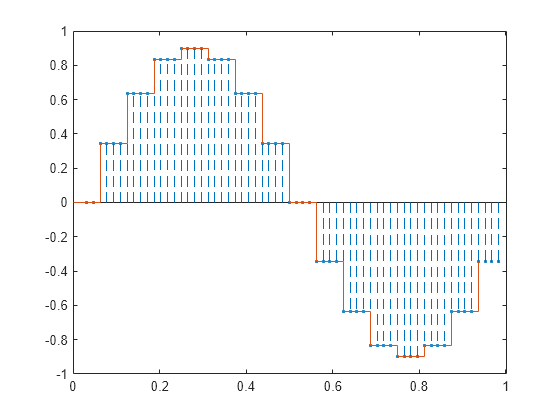
Puede obtener el mismo comportamiento utilizando la función interp1 de MATLAB® con la interpolación del elemento más cercano. En ese caso, debe cambiar el origen para alinear la secuencia.
zi = interp1(t,x,tu,'nearest');

dl = floor(ups/2);

stem(tu(1+dl:end),zi(1:end-dl),'--.')
hold on
stairs(t,x)
hold off

La función resample produce el mismo resultado cuando establece el último argumento de entrada en cero.
q = resample(x,ups,1,0);

stem(tu(1+dl:end),q(1:end-dl),'--.')
hold on
stairs(t,x)
hold off
