Simulate a Sample-and-Hold System
This example shows several ways to simulate the output of a sample-and-hold system by upsampling and filtering a signal.
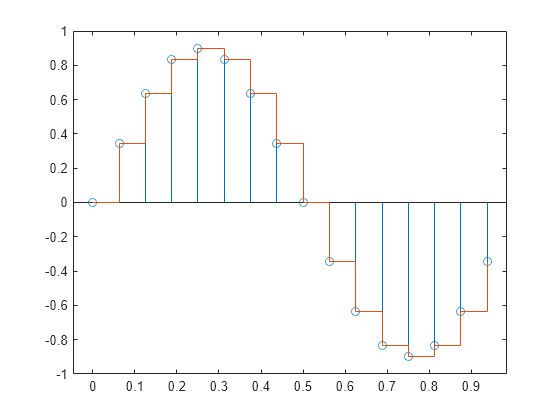
Construct a sinusoidal signal. Specify a sample rate such that 16 samples correspond to exactly one signal period. Draw a stem plot of the signal. Overlay a stairstep graph for sample-and-hold visualization.
fs = 16;
t = 0:1/fs:1-1/fs;

x = .9*sin(2*pi*t);

stem(t,x)
hold on
stairs(t,x)
hold off
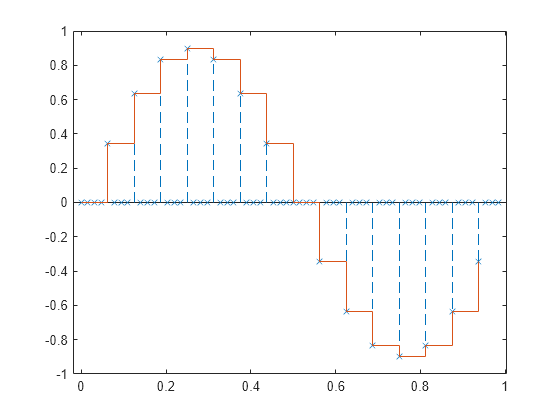
Upsample the signal by a factor of four. Plot the result alongside the original signal. upsample increases the sample rate of the signal by adding zeros between the existing samples.
ups = 4;

fu = fs*ups;
tu = 0:1/fu:1-1/fu;

y = upsample(x,ups);

stem(tu,y,'--x')

hold on
stairs(t,x)
hold off
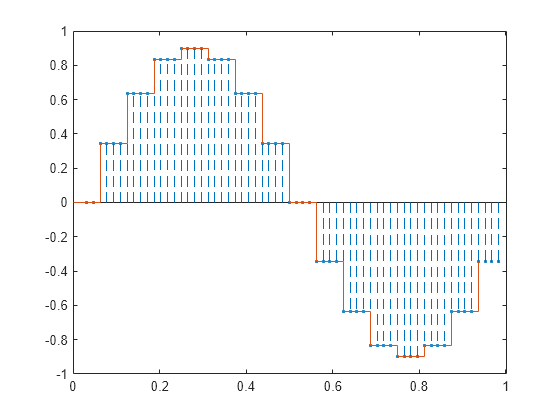
Filter with a moving-average FIR filter to fill in the zeros with sample-and-hold values.
h = ones(ups,1);

z = filter(h,1,y);

stem(tu,z,'--.')
hold on
stairs(t,x)
hold off

You can obtain the same behavior using the MATLAB® function interp1 with nearest-neighbor interpolation. In that case, you must shift the origin to line up the sequence.
zi = interp1(t,x,tu,'nearest');

dl = floor(ups/2);

stem(tu(1+dl:end),zi(1:end-dl),'--.')
hold on
stairs(t,x)
hold off
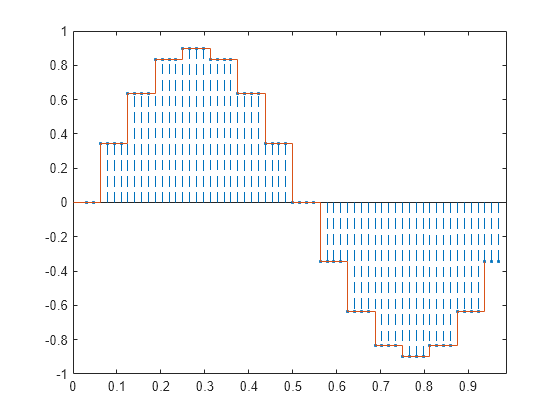
The function resample produces the same result when you set the last input argument to zero.
q = resample(x,ups,1,0);

stem(tu(1+dl:end),q(1:end-dl),'--.')
hold on
stairs(t,x)
hold off