Main Content

Simulink.sdi.Signal

Access signal data and metadata

Description

A Simulink.sdi.Signal object contains data and metadata for a signal in the Simulation Data Inspector. You can use the Signal object properties to inspect signal metadata, visualize signals on time plots, and compare signals using the Simulink.sdi.compareSignals function.

Creation

A Simulink.sdi.Signal object is created for each signal you log in a model simulation or import into the Simulation Data Inspector. You can access Signal objects in the Simulation Data Inspector several ways. Generally, to access a Signal object, you first need to get the Simulink.sdi.Run object that contains the signal.

  • The Simulink.sdi.getSignal function returns a Signal object that corresponds to the signal ID you provide.

  • The getSignal function returns the Signal object with the specified signal ID inside the specified Run object.

  • The getSignalByIndex function returns the Signal object at the specified index within the specified Run object.

Properties

expand all

Signal Properties

This property is read-only.

Unique number identifying the signal, returned as an integer. The Simulation Data Inspector assigns a unique numeric ID to each run and signal.

This property is read-only.

Run identifier for the run that contains the signal, returned as an integer. The Simulation Data Inspector assigns a unique numeric ID to each run and signal.

Name of the signal, specified as a character vector or a string. When the Signal object contains data logged from a simulation, the name matches the name specified for the signal in the model. If the model does not specify the name, the signal name is the block path to the block that produces the signal.

Example: 'fuel'

Signal type, specified as one of these options:

  • 'Signals' — Signal logging data.

  • 'Outports' — Output logging data.

  • 'States' — States logging data.

  • 'Data Store Memory' — Data store memory logging data.

  • 'Parametrs' — Logged parameter data.

  • 'Stateflow' — Stateflow® data.

  • 'Simscape' — Simscape™ data.

  • 'Assessments'Simulink® Test™ assessment data.

  • 'Profiling' — Execution profiling data.

The Domain property is empty for data not created by logging simulation data.

Description of the signal, specified as a character vector or a string. You can use the Description property to annotate the signal or identify the signal content beyond the Name. When you log Simscape data to the Simulation Data Inspector, the Description property is populated automatically for each node.

This property is read-only.

Units of signal data stored on disk, specified as a character vector or a string. For signals generated from simulating a model, the stored units of the Signal objects use the units specified in the model. When you specify display units for a signal without units, the same units are used to set the stored units. To analyze a signal alongside another that uses different units, modify the display units for the signal. The Simulation Data Inspector performs the conversion to plot the data using the display units.

You can convert the stored units for a signal using the convertUnits function. Stored unit conversion does not support undo and may result in precision loss.

Example: 'g/s'

Units used to display signal data in the Simulation Data Inspector, specified as a character vector or a string. The display units for a signal may differ from the stored units that reflect the data stored on disk. Modify signal display units to analyze data in the Simulation Data Inspector. Unit preferences in the Simulation Data Inspector may change the display units for logged and imported signal data. For more information, see Signal Display Units.

Example: 'm/s'

This property is read-only.

Data type of signal data, returned as a character vector or string.

Example: 'double'

This property is read-only.

Complexity of signal data, returned as "real" or "complex".

Example: "real"

This property is read-only.

Signal sample time, returned as a character vector or scalar. A value of 'Continuous' indicates a variable-step simulation.

Example: 'Continuous'

Example: '0.1'

This property is read-only.

Name of the model that produced the signal, returned as a character vector. The Model property is empty for Signal objects that contain data that was not produced by simulating a model.

Example: 'sldemo_fuelsys'

This property is read-only.

Block path for the block that produced the signal, returned as a character array. The BlockPath property is a relative path that does not include model hierarchy. The BlockPath property is empty for Signal objects that contain data that was not produced by simulating a model.

Example: 'sldemo_fuelsys/Engine Gas Dynamics'

This property is read-only.

Complete block path for the block that produced the signal, including the full model hierarchy, returned as a character vector. For signals within referenced models, FullBlockPath is a cell array that contains the full path. For other signals, FullBlockPath is identical to BlockPath. The FullBlockPath property is empty for Signal objects that contain data that was not produced by simulating a model.

This property is read-only.

Name of the block that produced the signal, returned as a character vector. The BlockName property is empty for Signal objects that contain data that was not produced by simulating a model.

Example: 'Engine Gas Dynamics'

This property is read-only.

Index of the output port connected to the signal on the block that produces the signal. The PortIndex property is empty for Signal objects that contain data that was not produced by simulating a model.

Example: 1

This property is read-only.

Signal dimensions, returned as an integer or integer array.

Example: [1 2]

This property is read-only.

Index of the signal within a matrix, returned as an integer array.

This property is read-only.

Number of samples in the signal, returned as an integer.

Time and data values for the signal, returned as a timeseries object for non-bus signals or structure matching the bus hierarchy for bus signals.

This property is read-only.

Name of the high-level structure containing the signal, returned as a character vector. The RootSource property only has value for imported signals.

Example: When you import the Simulink.SimulationOutput object simOut containing structure xout, the RootSource is 'simOut.get('xout')'

This property is read-only.

Path to the signal time data, returned as a character vector. The TimeSource property only has value for imported signals.

Example: When you import the Simulink.SimulationOutput object simOut containing structure xout, the TimeSource is 'simOut.get('xout').time'

This property is read-only.

Path to the signal sample values, returned as a character array. The DataSource property only has value for imported signals.

Example: When you import the Simulink.SimulationOutput object simOut containing structure xout, the DataSource is 'simOut.get('xout').signals(1).values'

This property is read-only.

Signals contained by the composite signal, returned as Simulink.sdi.Signal objects. The Children property is empty for scalar signals.

Scaling used to display signal data in the Simulation Data Inspector, specified as a real non-zero scalar. Display Scaling acts as a multiplier, allowing you to scale the appearance of an individual signal in the Simulation Data Inspector. Scaling the display does not change the data values of the signal. Signals scale differently depending on the visualization type.

VisualizationScaling
Time PlotScale an individual signal display in the y direction.
SparklinesScale an individual signal display in the y direction.
XYScale signal display in the y direction and x direction independently.
ArrayScale each element of the multidimensional signal display in the same manner in the y direction.
MapScale signal display in the longitudinal and latitudinal directions independently. Note that this allows you to convert other units to longitude and latitude.

Offset used to display signal data in the Simulation Data Inspector, specified as a real scalar. Display Offset allows you to shift the appearance of an individual signal in the Simulation Data Inspector. Offsetting the display does not change the data values of the signal. Signals shift differently depending on the visualization type.

VisualizationScaling
Time PlotShift an individual signal display in the y direction.
SparklinesShift an individual signal display in the y direction.
XYShift signal display in the y direction and x direction independently.
ArrayShift each element of the multidimensional signal display in the same manner in the y direction.
MapShift signal display in the longitudinal and latitudinal directions independently.

Visualization Properties

Complex format used to display complex signal data in the Simulation Data Inspector, specified as one of the following values. You can modify the ComplexFormat property for a Signal object to change how the Simulation Data Inspector displays the signal data when the object contains data for a complex signal.

  • "real-imaginary" — The real and imaginary components of the signal display together when you plot the signal. The imaginary component of the signal is plotted with a different shade of the Line Color.

  • "magnitude" — The magnitude of the signal displays when you plot the signal.

  • "magnitude-phase" — The magnitude and phase of the signal display together when you plot the signal.

  • "phase" — The phase of the signal displays when you plot the signal. The phase is plotted with a different shade of the Line Color.

Data Types: char | string

Whether the signal is plotted, specified as a logical value. Setting Checked to false clears the signal from all subplots. Setting Checked to true plots the signal on the active subplot.

Data Types: logical

Color of signal in plots, specified as a 1-by-3 RGB vector with values between 0 and 1.

Example: [0 0.5 0.5]

Data Types: double

Signal line style used when the signal is plotted in the Simulation Data Inspector, specified as one of these options:

  • '-' — Solid

  • '--' — Dashed

  • ':' — Dotted

  • '-.' — Dash-dotted

Signal line width used when the signal is plotted in the Simulation Data Inspector, specified as an integer between 1 and 20, inclusive.

Interpolation method used in data visualization and the synchronization step of comparisons, specified as one of the following values:

  • 'zoh' — Zero-order hold interpolation

  • 'linear' — Linear interpolation

  • 'none' — No interpolation

For more information about the interpolation options, see How the Simulation Data Inspector Compares Data.

Comparison Properties

Absolute tolerance to use in signal comparisons, specified as a positive-valued scalar.

The Simulation Data Inspector uses tolerances specified in the signal properties of the baseline signal when the OverrideGlobalTol property is set to 1 or true. For more information about tolerances in the Simulation Data Inspector, see How the Simulation Data Inspector Compares Data.

Example: 0.1

Data Types: double

Relative tolerance to use in signal comparisons, specified as a positive-valued scalar. The relative tolerance is expressed as a fractional multiplier. For example, 0.1 specifies a 10 percent tolerance.

The Simulation Data Inspector uses tolerances specified in the signal properties of the baseline signal when the OverrideGlobalTol property is set to 1 or true. For more information about tolerances in the Simulation Data Inspector, see How the Simulation Data Inspector Compares Data.

Example: 0.05

Data Types: double

Time tolerance for the signal used in signal comparisons, specified as a positive-valued scalar. Specify the time tolerance in seconds.

The Simulation Data Inspector uses tolerances specified in the signal properties of the baseline signal when the OverrideGlobalTol property is set to 1 or true. For more information about tolerances in the Simulation Data Inspector, see How the Simulation Data Inspector Compares Data.

Example: 0.1

Data Types: double

Whether comparisons use signal tolerance values instead of global tolerance values, specified as a logical value. Set the OverrideGlobalTol property to 1 or true to use the tolerance values defined in the Signal object properties. Set the property to 0 or false to use global tolerance values.

For more information about tolerances in the Simulation Data Inspector, see How the Simulation Data Inspector Compares Data.

Data Types: logical

Method used to synchronize signals in comparisons, specified as 'union' or 'intersection'. For more information about the synchronization options, see How the Simulation Data Inspector Compares Data.

Object Functions

convertUnits Convert units of Simulink.sdi.Signal object
export Export data for signal in Simulation Data Inspector to workspace or file
getAsTall Create tall timetable from Simulink.sdi.Signal object
plotOnSubPlot Plot Simulink.sdi.Signal object on Simulation Data Inspector subplot

Examples

collapse all

You can programmatically specify signal tolerance values to use in comparisons performed using the Simulation Data Inspector. In this example, you compare data collected by simulating a model of an aircraft longitudinal flight control system. Each simulation uses a different value for the input filter time constant and logs the input and output signals. You analyze the effect of the time constant change by comparing results using the Simulation Data Inspector and signal tolerances.

First, load the session file that contains the simulation data.

Simulink.sdi.load('AircraftExample.mldatx');

The session file contains four runs. In this example, you compare data from the first two runs in the file. Access the Simulink.sdi.Run objects for the first two runs loaded from the file.

runIDs = Simulink.sdi.getAllRunIDs;
runIDTs1 = runIDs(end-3);
runIDTs2 = runIDs(end-2);

Now, compare the two runs without specifying any tolerances.

noTolDiffResult = Simulink.sdi.compareRuns(runIDTs1,runIDTs2);

Use the getResultByIndex function to access the comparison results for the q and alpha signals.

qResult = getResultByIndex(noTolDiffResult,1);
alphaResult = getResultByIndex(noTolDiffResult,2);

Check the Status of each signal result to see whether the comparison result fell within our out of tolerance.

qResult.Status
ans = 
  ComparisonSignalStatus enumeration

    OutOfTolerance

alphaResult.Status
ans = 
  ComparisonSignalStatus enumeration

    OutOfTolerance

The comparison used a value of 0 for all tolerances, so the OutOfTolerance result means the signals are not identical.

You can further analyze the effect of the time constant by specifying tolerance values for the signals. Specify the tolerances by setting the properties for the Simulink.sdi.Signal objects that correspond to the signals being compared. Comparisons use tolerances specified for the baseline signals. This example specifies a time tolerance and an absolute tolerance.

To specify a tolerance, first access the Signal objects from the baseline run.

runTs1 = Simulink.sdi.getRun(runIDTs1);
qSig = getSignalsByName(runTs1,'q, rad/sec');
alphaSig = getSignalsByName(runTs1,'alpha, rad');

Specify an absolute tolerance of 0.1 and a time tolerance of 0.6 for the q signal using the AbsTol and TimeTol properties.

qSig.AbsTol = 0.1;
qSig.TimeTol = 0.6;

Specify an absolute tolerance of 0.2 and a time tolerance of 0.8 for the alpha signal.

alphaSig.AbsTol = 0.2;
alphaSig.TimeTol = 0.8;

Compare the results again. Access the results from the comparison and check the Status property for each signal.

tolDiffResult = Simulink.sdi.compareRuns(runIDTs1,runIDTs2);
qResult2 = getResultByIndex(tolDiffResult,1);
alphaResult2 = getResultByIndex(tolDiffResult,2);

qResult2.Status
ans = 
  ComparisonSignalStatus enumeration

    WithinTolerance

alphaResult2.Status
ans = 
  ComparisonSignalStatus enumeration

    WithinTolerance

This example shows how to obtain a Simulink.sdi.Signal object and modify its properties using the Simulation Data Inspector programmatic interface.

Create Data in the Simulation Data Inspector

When you simulate a model that logs data, a run is created in the Simulation Data Inspector to contain the logged data. You can also create a run in the Simulation Data Inspector by importing data. This example simulates the slexAircraftExample model and logs the data in Dataset format.

simOut = sim('slexAircraftExample','SaveFormat','Dataset');

Get a Simulink.sdi.Signal Object

The programmatic simulation returns the logged data in the workspace variable simOut. You can access the logged data in that variable. However, to use the Simulation Data Inspector programmatic interface, you need to access the logged data in Simulink.sdi.Run and Simulink.sdi.Signal objects.

First, use the Simulink.sdi.getCurrentSimulationRun to get the Run object that was created when you simulated the slexAircraftExample model.

aircraftRun = Simulink.sdi.getCurrentSimulationRun('slexAircraftExample');

You can use the getAllSignals function to access the Signal objects for all the signals in the run. From the returned array of Signal objects, select the first signal.

signals = getAllSignals(aircraftRun);
sig = signals(1);

Modify the Signal Properties

The Simulink.sdi.Signal object has properties that specify options for comparing and visualizing the signal. Specify a line style and color for the signal. Then, use the Simulink.sdi.setSubPlotLayout to configure the Simulation Data Inspector to show a single subplot, and use the plotOnSubPlot function to plot the signal.

sig.LineColor = [1 0.4 0.6];
sig.LineDashed = '-';

Simulink.sdi.setSubPlotLayout(1,1)
plotOnSubPlot(sig,1,1,true)

Use the Simulink.sdi.view function to open the Simulation Data Inspector and view the plotted signal.

You can use the Simulation Data Inspector programmatic interface to compare signals within a single run. This example compares the input and output signals of an aircraft longitudinal controller.

First, load the session that contains the data.

Simulink.sdi.load('AircraftExample.mldatx');

Use the Simulink.sdi.Run.getLatest function to access the latest run in the data.

aircraftRun = Simulink.sdi.Run.getLatest;

Then, you can use the Simulink.sdi.getSignalsByName function to access the Stick signal, which represents the input to the controller, and the alpha, rad signal that represents the output.

stick = getSignalsByName(aircraftRun,'Stick');
alpha = getSignalsByName(aircraftRun,'alpha, rad');

Before you compare the signals, you can specify a tolerance value to use for the comparison. Comparisons use tolerance values specified for the baseline signal in the comparison, so set an absolute tolerance value of 0.1 on the Stick signal.

stick.AbsTol = 0.1;

Now, compare the signals using the Simulink.sdi.compareSignals function. The Stick signal is the baseline, and the alpha, rad signal is the signal to compare against the baseline.

comparisonResults = Simulink.sdi.compareSignals(stick.ID,alpha.ID);
match = comparisonResults.Status
match = 
  ComparisonSignalStatus enumeration

    OutOfTolerance

The comparison result is out of tolerance. You can use the Simulink.sdi.view function to open the Simulation Data Inspector to view and analyze the comparison results.

This example demonstrates how to access the Simulink.sdi.Run object for a Simulation Data Inspector run created by logging signals. From the Simulink.sdi.Run object you can get Simulink.sdi.Signal objects that contain the logged signal data and metadata. You can use the Signal objects and the plotOnSubPlot function to plot the data in the Simulation Data Inspector.

Create a Simulation Run and Access the Run Object

The ex_vdp model logs two signals. To create a simulation run containing the logged data, simulate the model.

sim('ex_vdp');

The Simulation Data Inspector keeps track of runs by assigning a unique numeric run ID to each run created by simulation, importing data, or opening a session. To access the run object for the simulation you just performed, use the Simulink.sdi.getAllRunIDs function and take the last run ID in the returned vector.

runIDs = Simulink.sdi.getAllRunIDs;
runID = runIDs(end);

Once you have the run ID for the run, you can use the Simulink.sdi.getRun function to get the Simulink.sdi.Run object that corresponds to the run. You can use the Run object to check the metadata associated with the run, including the number of signals in the run.

vdpRun = Simulink.sdi.getRun(runID);

vdpRun.SignalCount
ans = int32
    2

Plot Data Using Signal Objects

Use the getSignalByIndex function to access signals from the Run object, vdpRun.

signal1 = getSignalByIndex(vdpRun,1);
signal2 = getSignalByIndex(vdpRun,2);

Use the Simulink.sdi.setSubPlotLayout function to specify a 2-by-1 layout.

Simulink.sdi.setSubPlotLayout(2,1)

Before plotting the data, use the Simulink.sdi.clearAllSubPlots function to clear any data that is already plotted.

Simulink.sdi.clearAllSubPlots

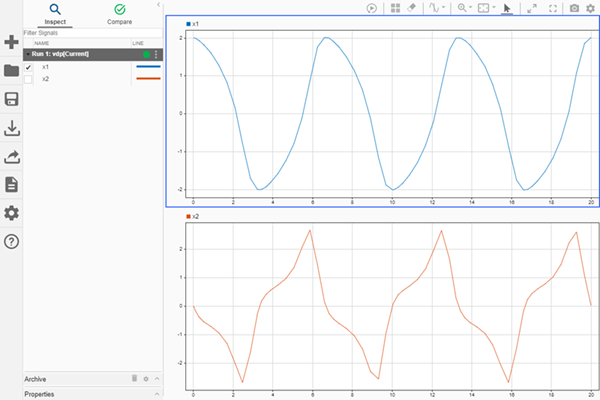
Plot one signal on each subplot. To plot signals on the first subplot, you can set the checked property for the signal. To plot signals on subplots other than the first subplot, use the plotOnSubPlot function.

signal1.Checked = true;
plotOnSubPlot(signal2,2,1,true);

View the Plotted Data

To view the plots you just created, open the Simulation Data Inspector using the Simulink.sdi.view function.

Version History

Introduced in R2012b