Visualize Linear System at Multiple Simulation Snapshots
This example shows how to visualize linear system characteristics of a nonlinear Simulink® model at multiple simulation snapshots.
Open Simulink model.
For example:
watertank
Open the Simulink Library Browser. In the Simulink Editor, on the Simulation tab, click Library Browser.
Add a plot block to the Simulink model.
In the Simulink Control Design library, select Linear Analysis Plots.
Drag and drop a block, such as the Gain and Phase Margin Plot block, into the Simulink model window.
The model now resembles the following figure.

Double-click the block to open the Block Parameters dialog box.
To learn more about the block parameters, see the block reference pages.
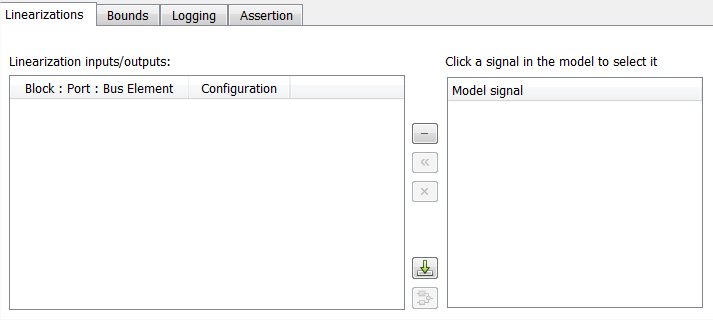
Specify the linearization I/O points.
The linear system is computed for the Water-Tank System.
Tip
If your model already contains I/O points, the block automatically detects these points and displays them. Click
 at any time to update
the Linearization inputs/outputs table with I/Os
from the model.
at any time to update
the Linearization inputs/outputs table with I/Os
from the model.To specify an input:
Click
 adjacent to the Linearization
inputs/outputs table.
adjacent to the Linearization
inputs/outputs table.The Block Parameters dialog box expands to display a Click a signal in the model to select it area.
In the Simulink model, click the output signal of the
PID Controllerblock to select it.The Click a signal in the model to select it area updates to display the selected signal.

Tip
You can select multiple signals at once in the Simulink model. All selected signals appear in the Click a signal in the model to select it area.
Click
 to add the signal to
the Linearization inputs/outputs table.
to add the signal to
the Linearization inputs/outputs table.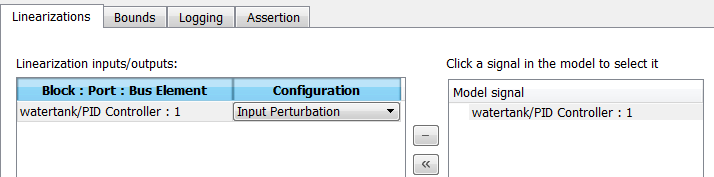
To specify an output:
In the Simulink model, click the output signal of the
Water-Tank Systemblock to select it.The Click a signal in the model to select it area updates to display the selected signal.
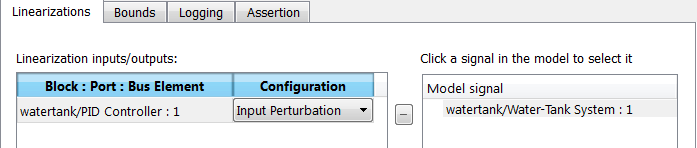
Click
to add the signal to
the Linearization inputs/outputs table.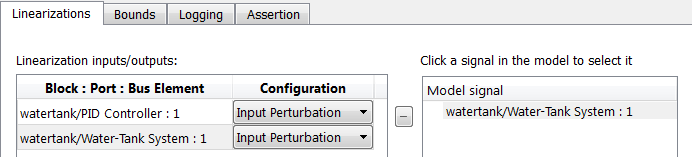
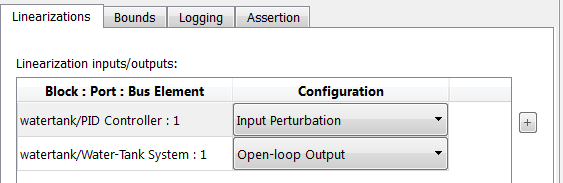
In the Configuration drop-down list of the Linearization inputs/outputs table, select
Open-loop Outputfor watertank/Water-Tank System : 1.
The Linearization inputs/outputs table now resembles the following figure.
Click
 to collapse the Click
a signal in the model to select it area.
to collapse the Click
a signal in the model to select it area.
Tip
Alternatively, before you add the Linear Analysis Plots block, right-click the signals in the Simulink model and, in the Linearization Manager app section
 , select input perturbation
  and open-loop output
  . Linearization I/O annotations appear in the model and
the selected signals appear in the Linearization inputs/outputs
table.
. Linearization I/O annotations appear in the model and
the selected signals appear in the Linearization inputs/outputs
table.Specify simulation snapshot times.
In the Linearizations tab, verify that
Simulation snapshotsis selected in Linearize on.In the Snapshot times field, type
[0 1 5].
Specify a plot type to plot the gain and phase margins. The plot type is
Bodeby default.Select
Nicholsin Plot typeClick Show Plot to open an empty Nichols plot.
Save the linear system.
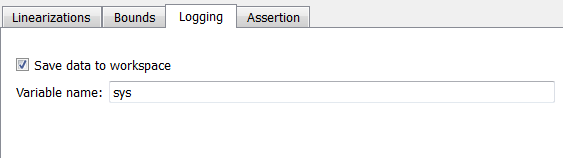
Select the Logging tab.
Select the Save data to workspace option and specify a variable name in the Variable name field.
The Logging tab now resembles the following figure.
Plot the gain and phase margins by clicking
 in the plot window.
The software linearizes the portion of the model between the linearization input and output at the simulation times of 0, 1 and 5 and plots gain and phase margins.
After the simulation completes, the plot window resembles the following figure.

Tip
Click
 to
view the legend.
to
view the legend.
The computed linear system is saved as sys in
the MATLAB® workspace. sys is a structure with time and values fields.
To view the structure, type:
sys
This command returns the following results:
sys =

         time: [3x1 double]
       values: [4-D ss]
    blockName: 'watertank/Gain and Phase Margin Plot'
The
timefield contains the simulation times at which the model is linearized.The
valuesfield is an array of state-space objects which store the linear systems computed at the specified simulation times.
(If the Simulink model is configured to save simulation output as a single object, the data
structure sys is a field in the
Simulink.SimulationOutput object that contains the logged simulation
data. For more information about data logging in Simulink, see Save Simulation Data and the Simulink.SimulationOutput reference page.)
See Also
Bode Plot | Gain and Phase Margin Plot | Linear Step Response Plot | Nichols Plot | Pole-Zero Plot | Singular Value Plot