Perform Analysis on a Model
This example illustrates how to use Simulink® Design Verifier™ to generate test cases that achieve complete model coverage. Through this example, you learn how to analyze models with Simulink Design Verifier and interpret the results.
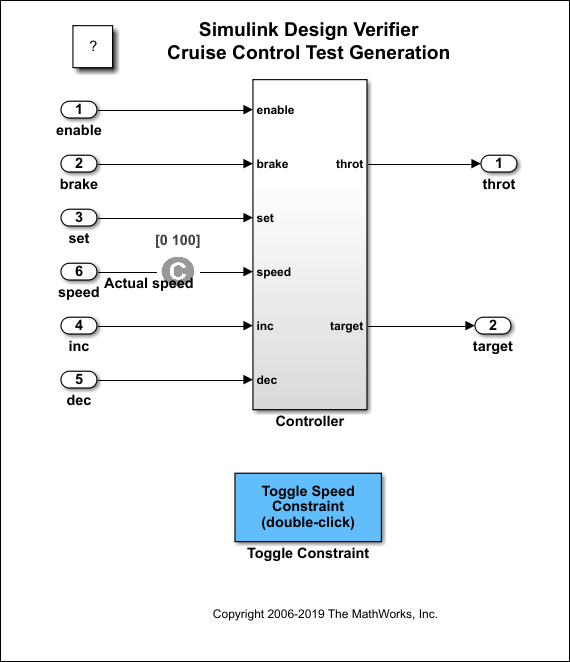
Open the Model
To open the sldvdemo_cruise_control model, at the MATLAB® prompt, enter:
openExample('sldv/CruiseControlTestGenerationExample',...
'supportingFile', 'sldvdemo_cruise_control');
Generate Test Cases
Run Analysis
To generate test cases for the sldvdemo_cruise_control
model, click on Generate Tests.
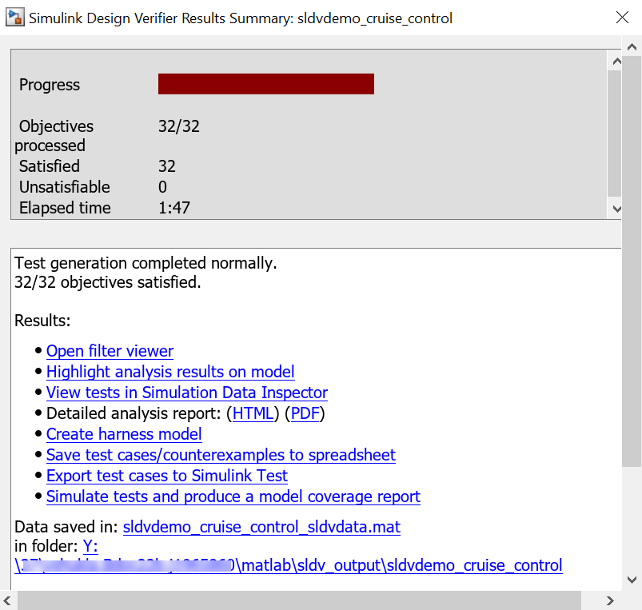
Simulink Design Verifier begins analyzing the model to generate test cases, and the Simulink Design Verifier Results Summary window opens. The Results Summary window displays a running log showing the progress of the analysis.
If you need to terminate an analysis while it is running, click Stop. The software asks if you want to produce results. If you click Yes, the software creates a data file based on the results achieved so far. The path name of the data file appears in the Results Summary window.
The data file is a MAT file that contains a structure named
sldvData. This structure stores the data that the
software gathers and produces during the analysis.
For more information, see View and Understand Analysis Results from Data Files.
Generate Analysis Results
When Simulink
Design Verifier completes its analysis of the
sldvdemo_cruise_control model, the Results Summary window
displays several options. Some of them are:
Highlight analysis results on model
Detailed analysis report: (HTML) (PDF)
Create harness model
Simulate tests and produce a model coverage report
Save test cases/counterexamples to spreadsheet
Note
When you analyze other models, depending on the results of the analysis, you may see a subset of options.
The sections that follow describe these options in detail.
Highlight Analysis Results on Model
In the Simulink Design Verifier Results Summary window, if you click Highlight analysis results on model, the software highlights objects in the model in three different colors, depending on the analysis results:
When you highlight the analysis results on a model, the Simulink Design Verifier Results Inspector opens. When you click an object in the model that has analysis results, the Results Inspector displays the results summary for that object.
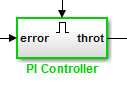
Green: Objectives Satisfied. Green outline indicates that the analysis generated test cases for all the objectives for that block. If the block is a subsystem or Stateflow® atomic subchart, the green outline indicates that the analysis generated test cases for all objectives associated with the child objects.
For example, in the sldvdemo_cruise_control model, the
green outline shows that the PI controller subsystem satisfied
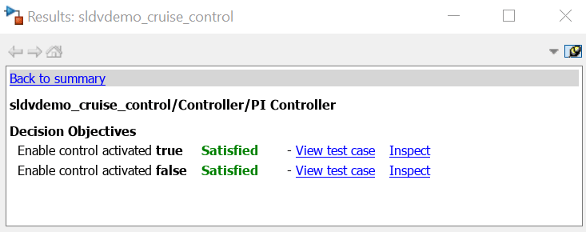
all test objectives. The Results
Inspector lists the two satisfied test objectives for the PI controller
subsystem.
Orange: Objectives Undecided. Orange outline indicates that the analysis was not able to determine if an objective was satisfiable or not. This situation might occur when:
The analysis times out
The software satisfies test objectives without generating test cases due to:
Automatic stubbing errors
Limitations of the analysis engine
Red: Objectives Unsatisfiable. Red outline indicates that the analysis found some objectives for which it could not generate test cases, most likely due to unreachable design elements in your model.
In the following example, input 2 always satisfies the criterion for the Switch block, so the Switch block never passes through the value of input 3.
Detailed analysis report: (HTML) (PDF)
In the Simulink Design Verifier Results Summary window, if you click HTMLon Detailed analysis report: (HTML) (PDF), the software saves and then opens a detailed report of the analysis. The path to the report is:
<current_folder>/sldv_output/...
     sldvdemo_cruise_control/sldvdemo_cruise_control_report.html
The HTML report includes the following chapters.
For a description of each report chapter, see:
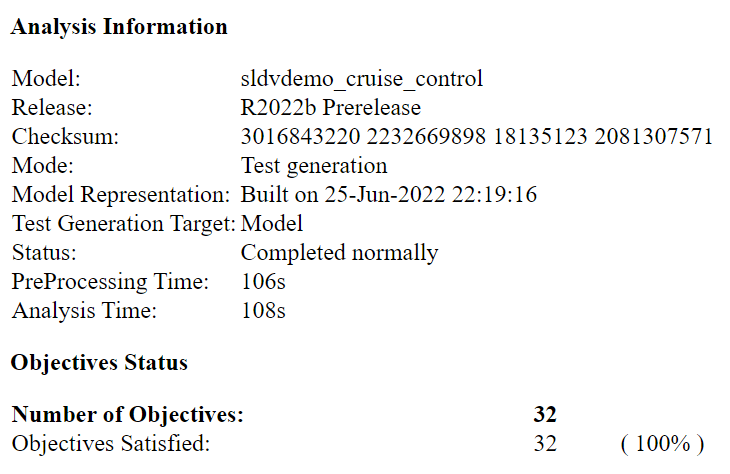
Summary. In the Table of Contents, click Summary to display the Summary chapter, which includes the following information under Analysis Information subsection:
Name of the model
Release and Checksum information
Mode of the analysis (test generation, property proving, design error detection)
Status of the analysis
Length of the analysis in seconds
The Objective Status sub-section under Summary shows number of objectives satisfied.
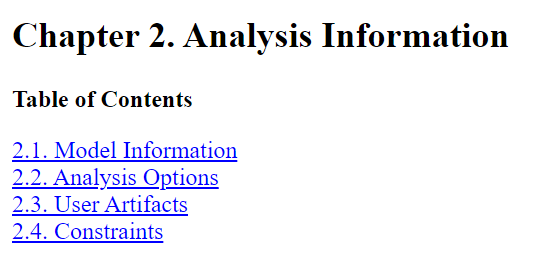
Analysis Information. In the Table of Contents, click Analysis Information to display information about the analyzed model and the analysis options. You can click on any of these options to know more about the model analysis.
Test Objectives Status. In the Table of Contents, click Test
Objectives Status to display a table of satisfied objectives.
The following figure shows a partial list of the objectives satisfied in the
sldvdemo_cruise_control model.
Objectives Status
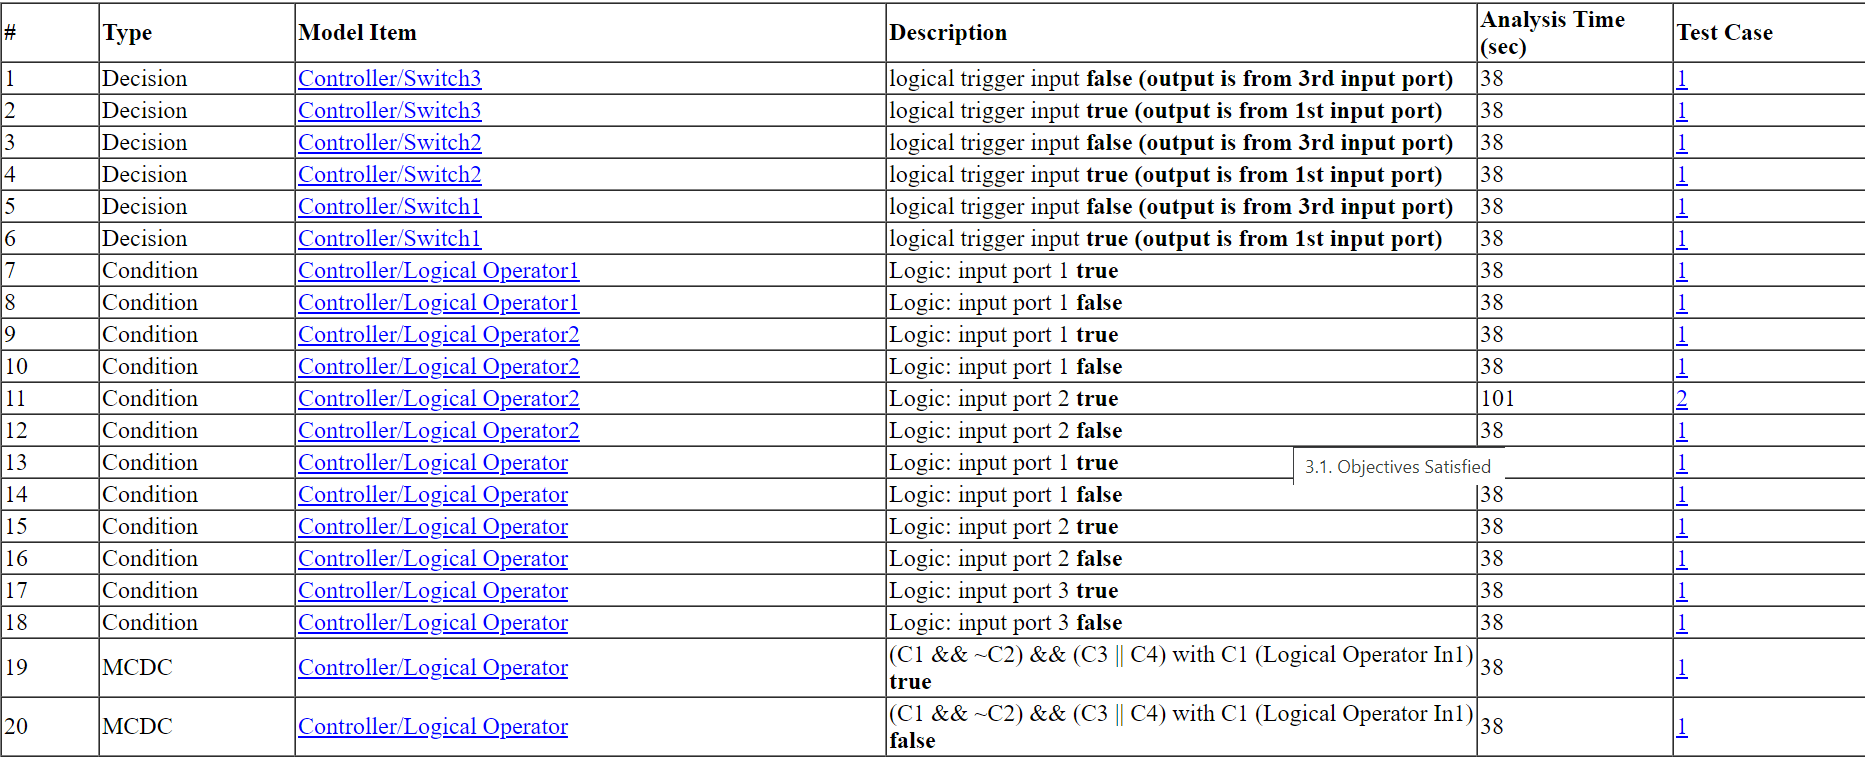
The Objectives Satisfied table lists the following information for the model:
# — Objective number
Type — Objective type
Model Item — Element in the model for which the objective was tested. Click this link to display the model with this element highlighted.
Description — Description of the objective
Test Case — Test case that achieves the objective. Click this link for more information about that test case.
In the row for objective 32, click the test case number (5) to display more information about Test Case 5 in the report's Test Cases chapter.
Test Case 5
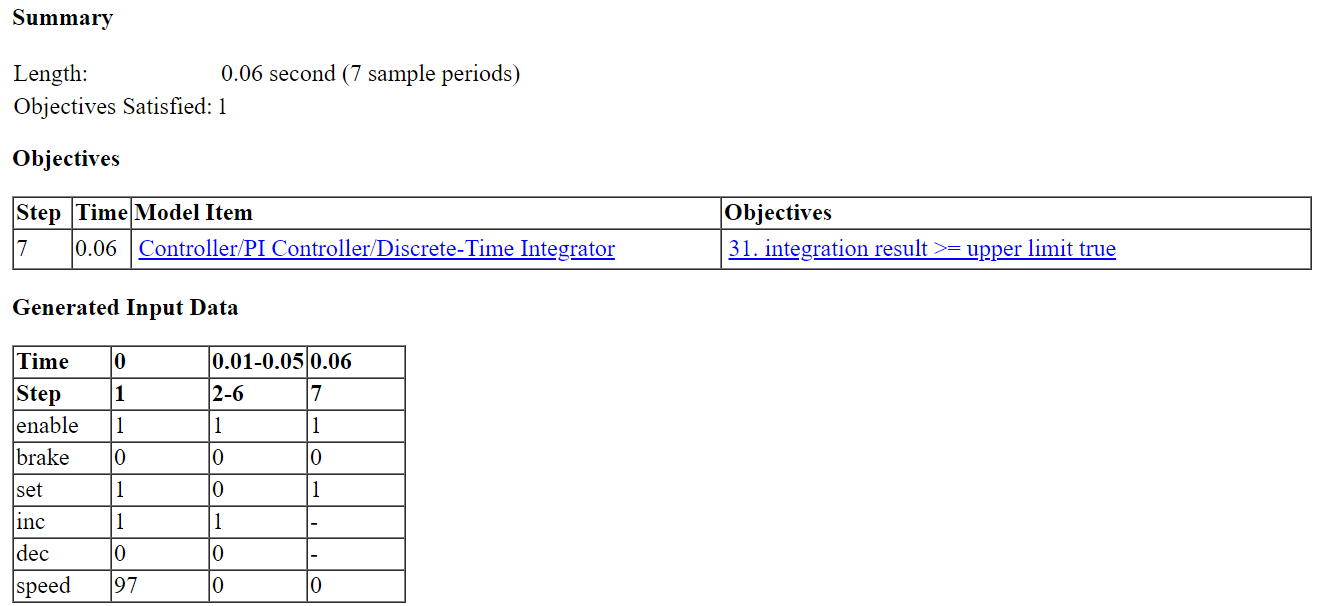
In this example, Test Case 5 satisfies one objective, that the integration
result be greater than or equal to the upper limit T in
the Discrete-Time Integrator block. The table lists the values of the six
signals from time 0 through time 0.06.
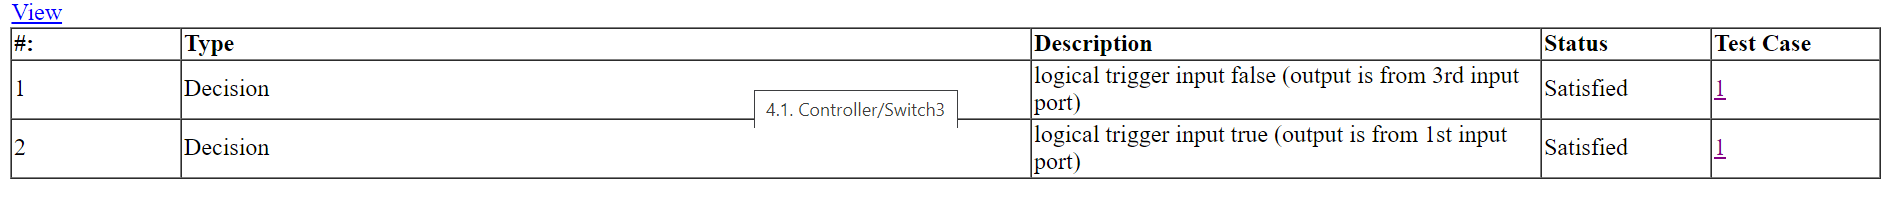
Model Items. In the Table of Contents, click Model Items to see detailed information about each item in the model that defines coverage objectives. This table includes the status of the objective at the end of the analysis. Click the links in the table for detailed information about the satisfied objectives.
Model Items - Controller/Switch3
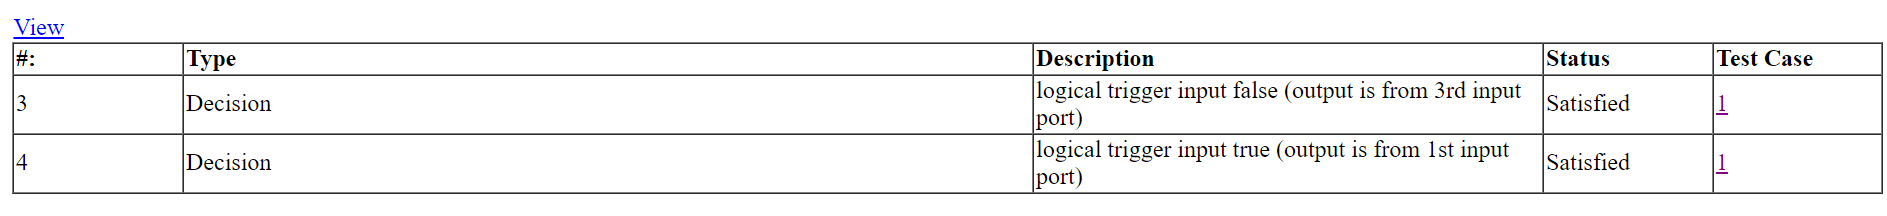
Model Items - Controller/Switch2
Test Cases. In the Table of Contents, click Test Cases to display detailed information about each generated test case, including:
Length of time to execute the test case
Number of objectives satisfied
Detailed information about the satisfied objectives
Input data
Create Harness Model
In the Simulink
Design Verifier Results Summary window, if you click Create harness
model, the software creates and opens a harness model named
sldvdemo_cruise_control_harness.
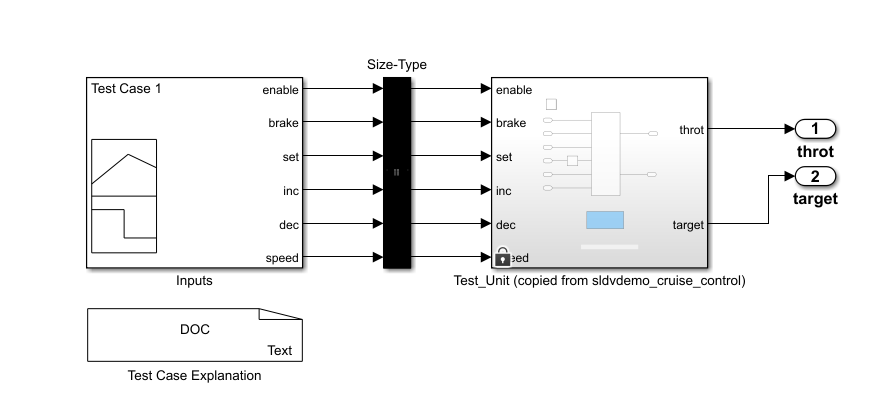
The harness model contains these blocks:
The
Test Case Explanationblock is a DocBlock block that documents the generated test cases. Double-click theTest Case Explanationto view a description of each test case for the objectives that the test case satisfies.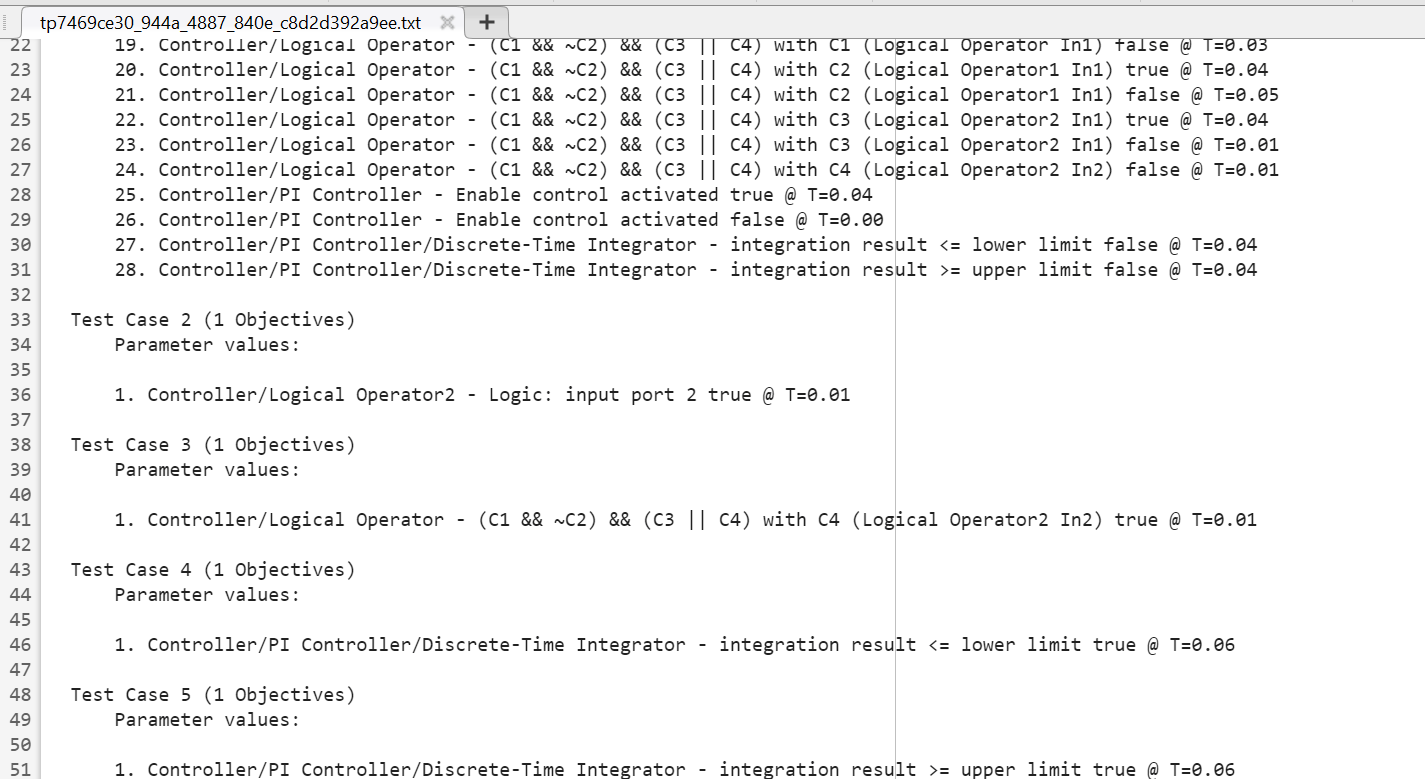
The
Test Unitblock is a Subsystem block that contains a copy of the original model that the software analyzed. Double-click theTest Unitblock to view its contents and confirm that it is a copy ofsldvdemo_cruise_controlmodel.Note
You can configure the harness model to reference the model that you are analyzing using a Model block instead of using a subsystem. In the Configuration Parameters dialog box, on the Design Verifier > Results pane, select Generate separate harness model after analysis and Reference input model in generated harness.
The
Inputsblock is a Signal Editor block that contains the generated test case signals. Double-click theInputsblock to open the Signal Editor dialog box and view the eight test case signals.The
Size-Typeblock is a subsystem that transmits signals from theInputsblock to theTest Unitblock. This block verifies that the size and data type of the signals are consistent with the Test Unit block.
The Block Parameter dialog box of the Inputs block contains
three test cases.
To view Test Case 3, from the Active scenario list, select
TestCase_3and then click the Open Signal Editor button to open the Signal Editor.
In Test Case 3, at 0.01 seconds:
The
enableandincsignals remain 1.The
brakeanddecsignals remain 0.The
setsignal transitions from 1 to 0.The
speedsignal transitions from 100 to 0.

In the
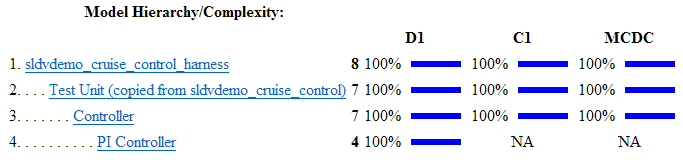
Inputsblock, the signal group satisfies the test objectives described in theTest Case Explanationblock.To confirm that Simulink Design Verifier achieved complete model coverage, simulate the harness model using all the test cases. In the toolstrip for the harness model, click Run all (Coverage).
The Simulink software simulates all the test cases. The Simulink Coverage™ software collects coverage data for the harness model and displays a coverage report. The report summary shows that the
sldvdemo_cruise_control_harnessmodel achieves 100% coverage.Summary
Simulate Tests and Produce Model Coverage Report
In the Simulink
Design Verifier Results Summary window, if you click Simulate tests and
produce a model coverage report, the software simulates the model
and produces a coverage report for the
sldvdemo_cruise_control model. The software stores the
report using this path and filename:
current_folder/sldv_output/sldvdemo_cruise_control/...
		sldvdemo_cruise_control_report.html
When you click Run all and produce coverage to simulate tests in the harness model, you may see these differences between this coverage report and the report you generated for the model itself:
The harness model coverage report might contain additional time steps. When you collect coverage for the harness model, the model stop time equals the stop time for the longest test case. As a result, you might achieve additional coverage when you simulate the shorter test cases.
The cyclomatic complexity coverage for the Test Unit subsystem in the harness model might be different than the coverage for the model itself due to the structure of the harness model.
Save Test Cases/Counterexamples to Spreadsheet
If you prefer to save the generated test cases or counterexamples in a spreadsheet, click Save test cases/counterexamples to spreadsheet in the Simulink Design Verifier Results Summary window.
Combine Test Cases
If you prefer to review results that are combined into a smaller number of test
cases, set the Test suite optimization parameter to
LongTestcases. When you use the
LongTestcases optimization, the analysis generates
fewer, but longer, test cases that each satisfy multiple test objectives.
Open the sldvdemo_cruise_control model and rerun the analysis
with the LongTestcases optimization:
On the Design Verifier tab, in the Prepare section, from the drop-down menu for the mode settings, click Settings.
In the Configuration Parameters dialog box, under Design Verifier pane, select Test Generation, set the Test suite optimization parameter to
LongTestcases. Click Apply and OK to close the Configuration Parameters dialog box.In the
sldvdemo_cruise_controlmodel, click Generate Tests.In the Results Summary window, click Create harness model.
In the harness model, the
Inputsblock and theTest Case Explanationblock now contain one longer test case instead of the eight shorter test cases created earlier.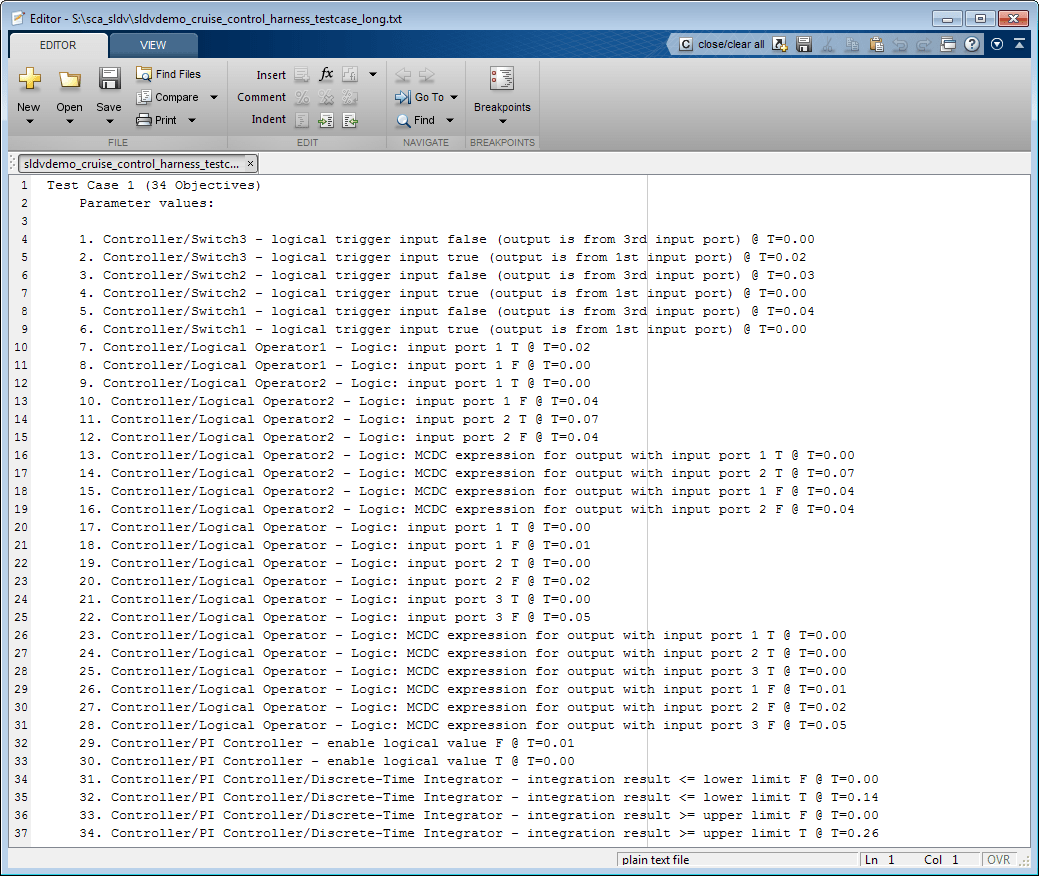
Click Run all and produce coverage to collect coverage.
The analysis still satisfies all 34 objectives.