Inspect Dead Logic with Model Slicer
If a block has dead logic, the root cause of the dead logic may not be in that block or may be further on the upstream or downstream of the block. In such a scenario, you can use Model Slicer to trace the root cause of the dead logic. This example shows you how to investigate the possible causes for the dead logic that occurs.
Open the Model
Open the model deadlogic by using:
open_system('deadlogic');Perform Design Error Detection Analysis
1. On the Design Verifier tab, in the Mode section, select Design Error Detection.
2. Click Error Detection Settings. In the Configuration Parameters dialog box, enable Dead Logic option.
3. In the Design Verifier tab, Click Detect Design Errors.
Review Analysis Results
1. Wait for the analysis to complete and utilize the Results window to peruse the dead logic. The input signal values listed under the Derived Ranges section, are highlighted in the Results window.
2. Click on the upstream and downstream of the block with dead logic to see the value ranges that the input and the output signals can accept.
3. To inspect the cause of the dead logic for the Switch block, select the Inspect option to launch the slicer tool.
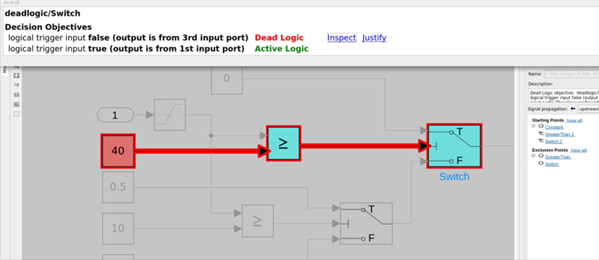
4. In this example, the upstream blocks that are highlighted solid red are likely the cause of the deadlogic and are shown as starting point in the slicer. The cyan blocks are connected upstream or downstream and are also deadlogic shown as exclusion point in the slicer. You can begin your investigation about the cause of the deadlogic from the highlighted red block.

5. In this example, the constant block is the cause for dead logic in the Relational Operator block, which explains why the logical trigger input FALSE for the Switch block is dead logic.