Main Content

plot

Generate execution profiler plot

Since R2020b

Description

example

plot(profiler_object) generates a plot from the profiler data.

The Execution Profiler and the SLRT Overload Options block use different mechanisms to measure TET and do not generate identical TET values.

Examples

collapse all

The real-time application is already loaded. Start the profiler. Start the application.

  1. tg = slrealtime('TargetPC1');
    startProfiler(tg);
    start(tg);
  2. Stop the profiler. Stop the application.

    stopProfiler(tg);
    stop(tg);
  3. Retrieve profiler data.

    profiler_object = getProfilerData(tg);
    Processing data, please wait ...
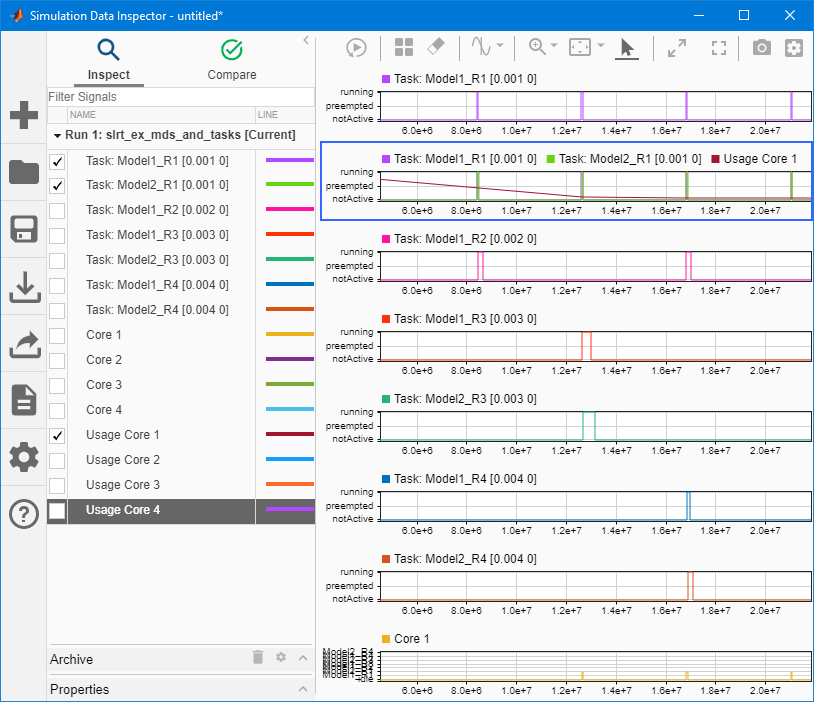
  4. Call plot function on the data.

    plot(profiler_object);

    The Simulation Data Inspector provides an execution profile diagram for the model.

Input Arguments

collapse all

MATLAB® variable that you can use to access the result of the profiler execution. You display the profiler data by calling the plot and report functions.

The structure has these fields:

  • TargetName — Name of target computer in target computer settings.

  • ModelInfo — Information about model on which profiler ran:

    • ModelName — Name of real-time application.

    • MATLABRelease — MATLAB release under which model was built.

You can access the data in the profiler_object variable. To access the profiler data, before running the profiler, open the Configuration Parameters dialog box. In the Real-Time tab, click Hardware Settings. Select the Code Generation > Verification > Workspace variable option and set the value to executionProfile. Select the Save options option and set the value to All data. After running the profiler, use the technique described for the Sections (Embedded Coder) function.

Version History

Introduced in R2020b