Plot Basic Input-Output Voltage Characteristics of Logic Gates
You can plot the basic input-output voltage characteristics of logic gates without building a complete model. Use these plots to explore the effects of your parameter choices on device characteristics. If you parameterize the block from a data sheet, then you can compare your plots to the data sheet to check that you parameterized the block correctly. If you have a complete working model but do not know which manufactured part to use, you can compare your plots to data sheets to help you decide.
To plot the basic characteristics, double-click the block and, in the Utilities section, click the Plot button next to the Basic characteristics parameter (since R2026a).
Before R2026a: Right-click the block and select Electrical > Basic Characteristics from the context menu.
The software computes a set of bias conditions using the block parameter values. It then opens a figure window that contains hypothetical plots of the input voltage waveforms and the corresponding output voltage waveform for the block.
For example, for the CMOS AND block with default parameter values, clicking the Plot button next to the Basic characteristics parameter generates this figure.
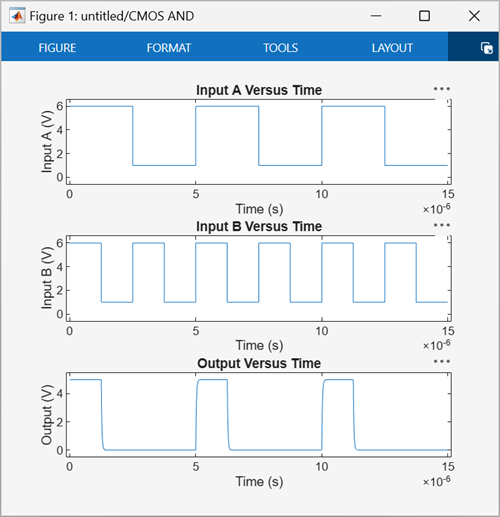
Here, when Input A and Input B are both higher than
the High level input voltage parameter value, which is 3 V, the
Output is close to the High level output voltage
parameter, which is 5 V. Otherwise, the Output is close to the
Low level output voltage parameter of 0 V.
Note
The plots you create using the Basic characteristics parameter do not show the effect of the Propagation delay parameter on the output voltage of logic blocks.
If you change the block parameter values and plot the characteristics again, the plot opens in a new window. You can compare the plots side-by-side to see how the parameter values affect the input-output voltage characteristics.
The Basic characteristics parameter is available in these logic blocks.