Compare Fixed-Point and Floating-Point Computation in Mandelbrot Set
This example shows the difference between fixed-point numbers and floating-point numbers by computing the Mandelbrot set using each data type. For more information, see Fixed-Point Data in Stateflow Charts.
The Mandelbrot set is the set of complex numbers,  , for which this sequence does not diverge:


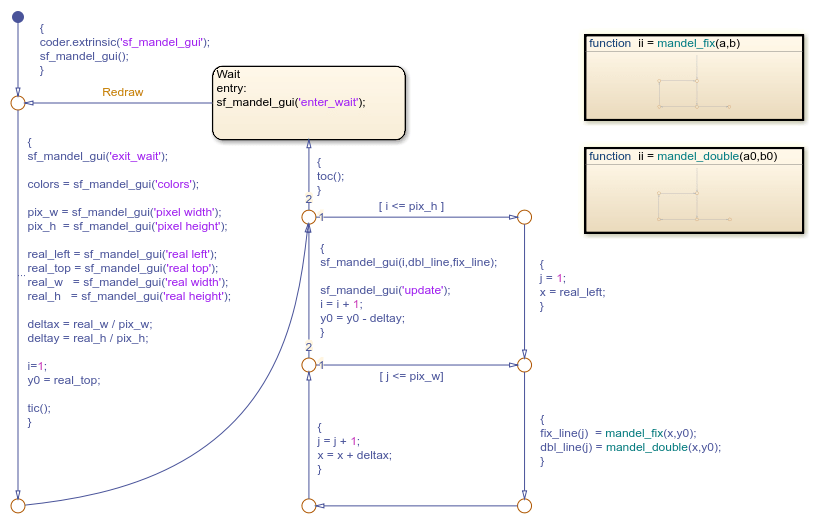
In this example, a Stateflow® chart creates two images of the Mandelbrot set by using fixed-point and floating-point computations. The chart wakes and calls the helper function sf_mandel_gui to initialize the display and obtain the initial pixel and figure information. Then the chart iterates through each row and column in the figure. The pixels in each figure represent points in the complex plane.
The x-coordinate of a pixel represents the real part of a complex number and the y-coordinate represents the imaginary part. For each pixel, the chart calls the graphical functions mandel_fix and mandel_double to compute the number of iterations it takes to determine whether the pixel is in the Mandelbrot set and maps the number to a color in a colormap. After the chart updates every pixel in the figures, the chart enters the Wait state and sleeps until you click on the image in the figure window to zoom into the figure.
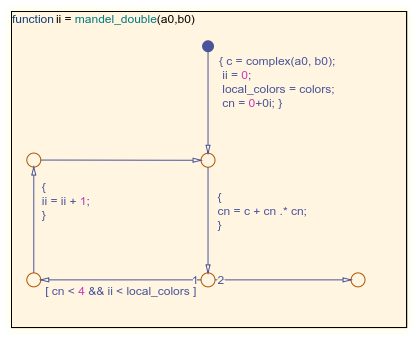
Compute Mandelbrot Set by Using Graphical Functions
The mandel_double function uses floating-point computation to compute the number of iterations required to determine if the point is not in the Mandelbrot set. If the sequence does not diverge before the number of local_colors iterations, the function determines the point is in the Mandelbrot set.
The mandel_fix function uses fixed-point computation. a0 and b0 are fixed-point numeric objects constructed from the input values. cn is a fixed-point numeric object with twice the word length and fraction length as a0 and b0.
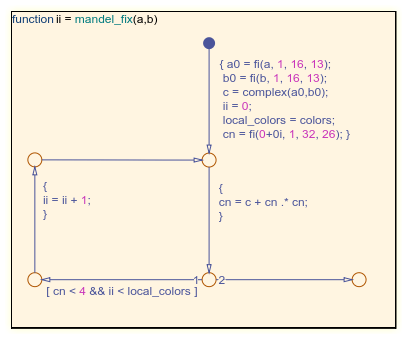
The fixed-point numeric object properties are specified in the Property Inspector, in the Fixed-point properties section. The chart uses a fixed-point numeric object with two's component overflow that rounds to negative infinity and has a word length of 32 and a fraction length of 26 for products and sums.
fimath('OverflowAction','Wrap',...
    'RoundingMethod','Floor',...
    'ProductMode', 'SpecifyPrecision',...
    'ProductWordLength', 32,...
    'ProductFractionLength', 26,...
    'SumMode', 'SpecifyPrecision',...
    'SumWordLength', 32,...
    'SumFractionLength', 26)
Run the Simulation
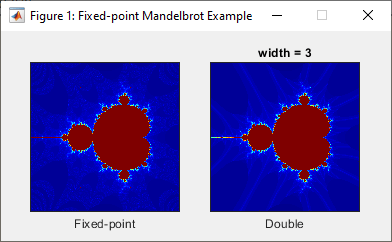
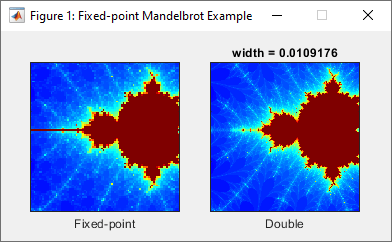
To start the simulation, press Run. In the figure window x-axis displays the interval from -2 to 1 and the y-axis displays the interval from -1.5 to 1.5. The color of the pixel corresponds to the number of iterations calculated in mandel_fix or mandel_double. Pixels that correspond to a complex number in the Mandelbrot set are dark red. Dark blue pixels indicate that mandel_fix or mandel_double required fewer iterations to determine the sequence diverged, and brighter colors indicate sequences that required more iterations to diverge.
To zoom in on a portion of the image, click and drag in the image window.
Observe the differences between the fixed-point image and the double image. The fixed-point image contains false positives due to the imprecision in comparison to floating point computations. Each computation in mandel_fix takes the floor of value as the rounding method. After many iterations, the rounding compounds and produces a round-off error that occurs when a point not in the Mandelbrot set does not produce a value of r2 that surpasses the threshold of 4 in the maximum number of iterations.
To zoom out, restart the simulation. The simulation continues to run until you click Stop.