predict
R2026bPredict responses using neighborhood component analysis (NCA) regression model
Syntax
Description
Examples
Load the sample data.
load robotarm.matThe robotarm data set contains 7168 training observations and 1024 test observations with 32 features of a robot arm simulator [1][2]. The data set in this example is a preprocessed version of the original data set. The data set used in this example is a preprocessed version of the original data set. The data was preprocessed by subtracting values given by a linear regression fit from the original data, followed by normalization of all features to unit variance.
Perform neighborhood component analysis (NCA) feature selection for regression with the default (regularization parameter) value.
rng(1,"twister") % For reproducibility
nca = fsrnca(Xtrain,ytrain,FitMethod="exact",Solver="lbfgs");
Plot the selected values.
figure
plot(nca.FeatureWeights,"ro")
xlabel("Feature Index")
ylabel("Feature Weight")
grid on
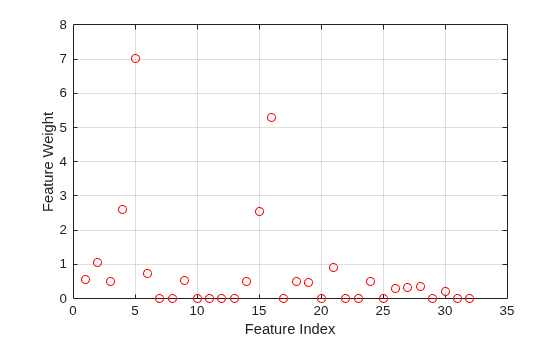
More than half of the feature weights are nonzero. Use the test set as a measure of performance and compute the loss using the selected features.
L = loss(nca,Xtest,ytest)
L =
0.0837
Compute the predicted response values for the test set and plot them versus the actual response.
ypred = predict(nca,Xtest);
figure
plot(ypred,ytest,"bo")
axis square
grid on
xlim([-4 4])
ylim([-4 4])
xlabel("Predicted Response")
ylabel("Actual Response")
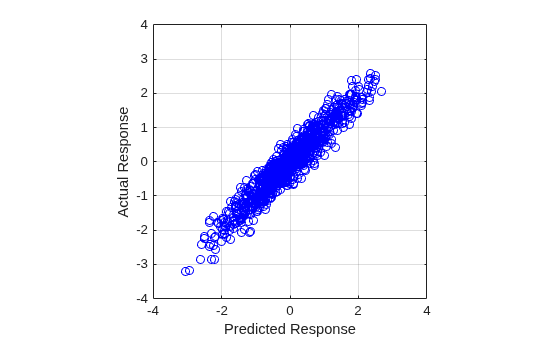
A perfect fit versus the actual values forms a 45-degree straight line. In this plot, the predicted and actual response values seem to be scattered around this line.
Try improving the performance. Tune the regularization parameter for feature selection using 5-fold cross-validation. Tuning means finding the value that produces the minimum regression loss.
First, partition the data into five folds. For each fold, cvpartition assigns 4/5th of the data as a training set, and 1/5th of the data as a test set.
n = length(ytrain);
cvp = cvpartition(length(ytrain),KFold=5);
numvalidsets = cvp.NumTestSets;
Assign the values for the search. Multiplying response values by a constant increases the loss function term by a factor of the constant. Therefore, including the std(ytrain) factor in the values balances the default loss function ("mad", mean absolute deviation) term and the regularization term in the objective function. In this example, the std(ytrain) factor is 1 because the loaded sample data is a preprocessed version of the original data set.
lambdavals = linspace(0,50,20)*std(ytrain)/n;
Create an array to store the loss values.
lossvals = zeros(length(lambdavals),numvalidsets);
Train the NCA model for each value using the training set in each fold. Compute the regression loss for the corresponding test set in the fold using the NCA model, and record the loss value. Repeat this process for each value and each fold.
for i = 1:length(lambdavals)
    for k = 1:numvalidsets
        X = Xtrain(cvp.training(k),:);
        y = ytrain(cvp.training(k),:);
        Xvalid = Xtrain(cvp.test(k),:);
        yvalid = ytrain(cvp.test(k),:);

        nca = fsrnca(X,y,FitMethod="exact", ...
             Solver="minibatch-lbfgs",Lambda=lambdavals(i), ...
             GradientTolerance=1e-4,IterationLimit=30);

        lossvals(i,k) = loss(nca,Xvalid,yvalid,LossFunction="mse");
    end
end
Compute the average loss obtained from the folds for each value.
meanloss = mean(lossvals,2);
Plot the mean loss versus the values.
figure
plot(lambdavals,meanloss,"ro-")
xlabel("Lambda")
ylabel("Loss (MSE)")
grid on
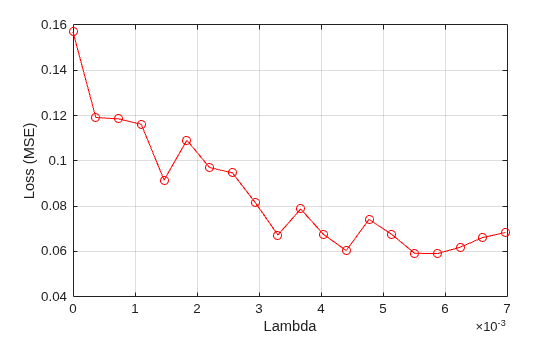
Find the value that gives the minimum loss value.
[~,idx] = min(meanloss)
idx =
17
bestlambda = lambdavals(idx)
bestlambda =
0.0059
bestloss = meanloss(idx)
bestloss =
0.0590
Fit the NCA feature selection model for regression using the best value.
nca2 = fsrnca(Xtrain,ytrain,FitMethod="exact", ...
    Solver="lbfgs",Lambda=bestlambda);
Plot the selected features.
figure
plot(nca2.FeatureWeights,"ro")
xlabel("Feature Index")
ylabel("Feature Weight")
grid on
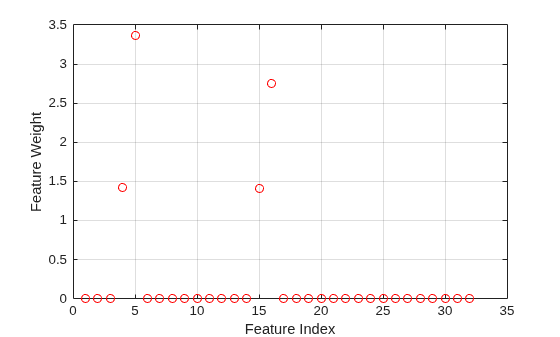
Most of the feature weights are zero. fsrnca identifies the four most relevant features.
Compute the loss for the test set.
L = loss(nca2,Xtest,ytest)
L =
0.0571
Tuning the regularization parameter eliminates more of the irrelevant features and improves the performance.
Plot the predicted versus the actual response values in the test set.
ypred = predict(nca2,Xtest);
figure
plot(ypred,ytest,"bo")
axis square
grid on
xlim([-4 4])
ylim([-4 4])
xlabel("Predicted Response")
ylabel("Actual Response")
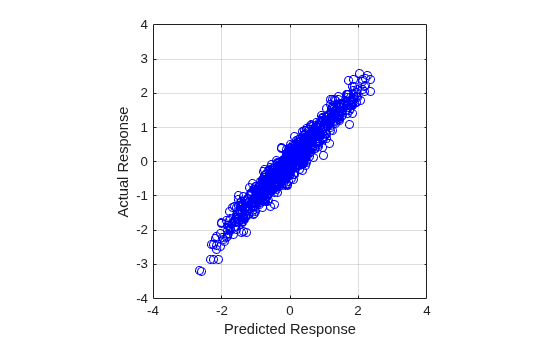
The predicted response values seem to be closer to the actual values.
Input Arguments
Output Arguments
Version History
Introduced in R2016b
See Also
FeatureSelectionNCARegression | loss | fsrnca | refit | selectFeatures

