Contenido principal

fsurfht

Interactive contour plot of function

Description

fsurfht(fun,Xlims,Ylims) creates an interactive contour plot of the function specified by fun, with plot limits defined by Xlims and Ylims.

example

fsurfht(fun,Xlims,Ylims,p1,p2,...,p5) allows for five optional parameters that you can supply to the function fun.

example

fsurfht with no input arguments creates an interactive contour plot of the peaks function.

Examples

collapse all

Create an interactive contour plot for the power function f(x,y) = xy. Specify plot ranges [0.1 1] for x and [1 10] for y.

fsurfht("power",[0.1 1],[1 10])

Figure power contains an axes object and other objects of type uicontrol. The axes object contains 23 objects of type contour, line, text.

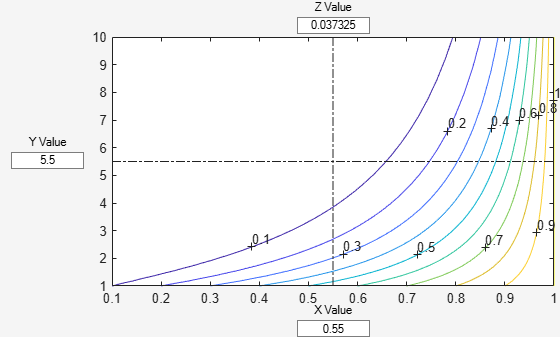
The Z Value box contains the value of the power function at the intersection of the dot-dashed cross hair lines at the center of the plot. Click on the plot or enter values in the X Value or Y Value boxes to display the function value at a different location.

Define a function named mytrigfun.m that returns a linear combination of two trigonometric functions.

Display the contents of the mytrigfun.m file.

type mytrigfun.m
function z = mytrigfun(X,Y,a,b,type)
    if type == "cos"
       z = a*cos(X)+b*cos(Y);
    else
       z = a*sin(X)+b*sin(Y);
    end
end

Note: If you click the button located in the upper-right section of this page and open this example in MATLAB®, then MATLAB opens the example folder. This folder includes the mytrigfun.m function file for this example.

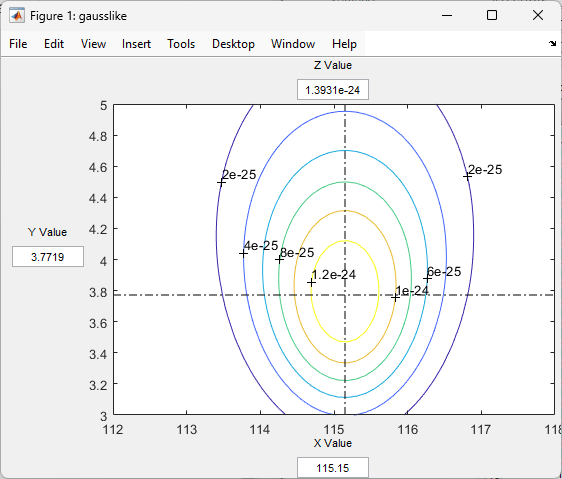
Create a contour plot of the function over the range –pi to pi for x and y. Specify a = 2 and b = –3 and to use a linear combination of sine functions.

fsurfht("mytrigfun",[-pi pi],[-pi pi],2,-3,"sin")

Figure mytrigfun contains an axes object and other objects of type uicontrol. The axes object contains 41 objects of type contour, line, text.

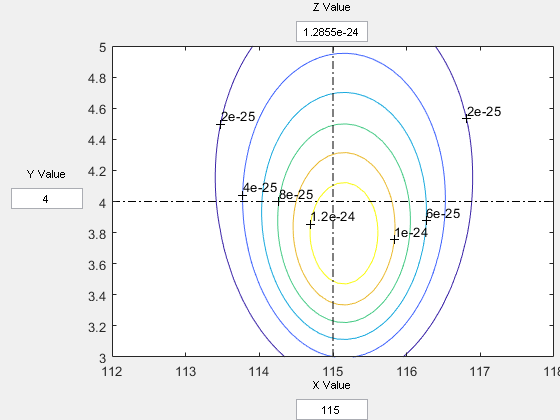
Evaluate z at the maximum by entering values in the fields labeled X Value and Y Value.

Input Arguments

collapse all

Prediction function, specified as the name of built-in function that accepts two numeric scalar input arguments, or the name of another function on the MATLAB® path. The function must have this form:

z = myFun(x,y,p1,p2,...,p5)

  • The output argument z is a numeric scalar.

  • You specify the function name (here, myFun).

  • x and y are numeric scalars.

  • p1,p2,...,p5 are optional parameters.

Example: fsurfht("power",[0.1 1],[1 4])

Example: fsurfht("myFun",[0 1],[1 10])

Data Types: string | char

X-axis limits, specified as a two-element vector [Xmin Xmax].

Data Types: single | double

Y-axis limits, specified as a two-element vector [Ymin Ymax].

Data Types: single | double

Function parameters, specified as values of any data type. You can specify up to five parameters as inputs to the function specified by fun.

Data Types: all

Tips

  • The intersection of the vertical and horizontal reference lines on the interactive plot defines the current x value and y value.

  • Drag the reference lines to watch the interpolated z value (at the top of the plot) update simultaneously.

  • Alternatively, obtain a specific interpolated z value by typing the x value and y value into editable text fields on the x-axis and y-axis, respectively.

Alternative Functionality

You can also create a contour plot using the contour function, which offers greater functionality than fsurfht. For an example, see Contours of a Function. When you create a contour plot with contour, you can display information about contour line values by setting datacursormode to "on" at the command line and then clicking a contour line in the plot.

Version History

Introduced before R2006a

expand all

See Also

| | | |