Main Content

updateMetrics

Update performance metrics in incremental drift-aware learning model given new data

Since R2022b

    Description

    example

    Mdl = updateMetrics(Mdl,X,Y) returns an incremental drift-aware learning model Mdl, which is the input incremental drift-aware learning model Mdl modified to contain the model performance metrics on the incoming predictor and response data, X and Y respectively.

    When the input model is warm (Mdl.IsWarm is true), updateMetrics overwrites previously computed metrics, stored in the Metrics property, with the new values. Otherwise, updateMetrics stores NaN values in Metrics instead.

    The input and output models have the same data type.

    Mdl = updateMetrics(Mdl,X,Y,Name=Value) uses additional options specified by one or more name-value arguments. For example, you can specify that the columns of the predictor data matrix correspond to observations, and set observation weights.

    Examples

    collapse all

    Create the random concept data using the HelperSineGenerator and concept drift generator HelperConceptDriftGenerator.

    concept1 = HelperSineGenerator("ClassificationFunction",1,"IrrelevantFeatures",true,"TableOutput",false);
    concept2 = HelperSineGenerator("ClassificationFunction",3,"IrrelevantFeatures",true,"TableOutput",false);
    driftGenerator = HelperConceptDriftGenerator(concept1,concept2,15000,1000);

    When ClassificationFunction is 1, HelperSineGenerator labels all points that satisfy x1 < sin(x2) as 1, otherwise the function labels them as 0. When ClassificationFunction is 3, this is reversed. That is, HelperSineGenerator labels all points that satisfy x1 >= sin(x2) as 1, otherwise the function labels them as 0.

    HelperConceptDriftGenerator establishes the concept drift. The object uses a sigmoid function 1./(1+exp(-4*(numobservations-position)./width)) to decide the probability of choosing the first stream when generating data [1]. In this case, the position argument is 15000 and the width argument is 1000. As the number of observations exceeds the position value minus half of the width, the probability of sampling from the first stream when generating data decreases. The sigmoid function allows a smooth transition from one stream to the other. Larger width values indicate a larger transition period where both streams are approximately equally likely to be selected.

    Initiate an incremental drift-aware model as follows:

    1. Create an incremental Naive Bayes classification model for binary classification.

    2. Initiate an incremental concept drift detector that uses the Hoeffding's Bounds Drift Detection Method with moving average (HDDMA).

    3. Using the incremental linear model and the concept drift detector, instantiate an incremental drift-aware model. Specify the training period as 5000 observations.

    BaseLearner = incrementalClassificationLinear(Solver="sgd");
    dd = incrementalConceptDriftDetector("hddma");
    idaMdl = incrementalDriftAwareLearner(BaseLearner,DriftDetector=dd,TrainingPeriod=5000);

    Preallocate the number of variables in each chunk and number of iterations for creating a stream of data.

    numObsPerChunk = 10;
    numIterations = 4000;

    Preallocate the variables for tracking the drift status and drift time, and storing the classification error.

    dstatus = zeros(numIterations,1);
    statusname = strings(numIterations,1);
    ce = array2table(zeros(numIterations,2),VariableNames=["Cumulative" "Window"]);
    driftTimes = [];

    Simulate a data stream with incoming chunks of 10 observations each and perform incremental drift-aware learning. At each iteration:

    1. Simulate predictor data and labels, and update the drift generator using the helper function hgenerate.

    2. Call updateMetrics to measure the cumulative performance and the performance within a window of observations. Overwrite the previous incremental model with a new one to track performance metrics.

    3. Call fit to fit the model to the incoming chunk. Overwrite the previous incremental model with a new one fitted to the incoming observations.

    4. Track and record the drift status and the classification error for visualization purposes.

    rng(12); % For reproducibility
    
    for j = 1:numIterations
     
     % Generate data
     [driftGenerator,X,Y] = hgenerate(driftGenerator,numObsPerChunk); 
    
     % Update performance metrics and fit the model
     idaMdl = updateMetrics(idaMdl,X,Y); 
     idaMdl = fit(idaMdl,X,Y);
    
     % Record drift status and classification error
     statusname(j) = string(idaMdl.DriftStatus); 
     ce{j,:} = idaMdl.Metrics{"ClassificationError",:};
     if idaMdl.DriftDetected
           dstatus(j) = 2;  
           driftTimes(end+1) = j; 
        elseif idaMdl.WarningDetected
           dstatus(j) = 1;
        else 
           dstatus(j) = 0;
        end   
      
    end

    Plot the cumulative and per window classification error. Mark the warmup and training periods, and where the drift was introduced.

    h = plot(ce.Variables);
    
    xlim([0 numIterations])
    ylim([0 0.08])
    ylabel("Classification Error")
    xlabel("Iteration")
    
    xline((idaMdl.BaseLearner.EstimationPeriod+idaMdl.MetricsWarmupPeriod)/numObsPerChunk,"g-.","Estimation + Warmup Period",LineWidth=1.5)
    xline((idaMdl.MetricsWarmupPeriod+idaMdl.BaseLearner.EstimationPeriod)/numObsPerChunk+driftTimes,"g-.","Estimation Period + Warmup Period",LineWidth=1.5)
    xline(driftTimes,"m--","Drift",LabelVerticalAlignment="middle",LineWidth=1.5)
    
    legend(h,ce.Properties.VariableNames)
    legend(h,Location="best")

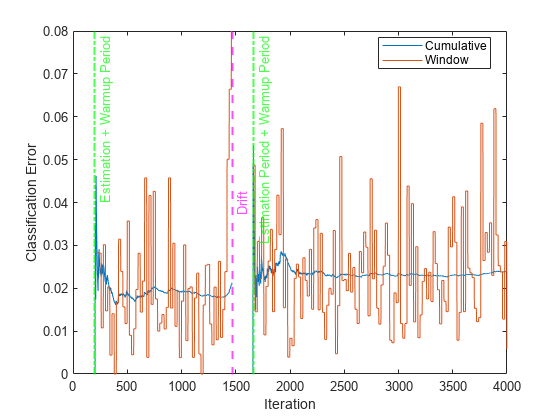
    The plot suggests the following:

    • updateMetrics computes the performance metrics after the estimation and metrics warm-up period only.

    • updateMetrics computes the cumulative metrics during each iteration.

    • updateMetrics computes the window metrics after processing the default metrics window size (200) observations.

    • After drift detection updateMetrics function waits for idaMdl.BaseLearner.EstimationPeriod+idaMdl.MetricsWarmupPeriod observations to start updating model performance metrics again.

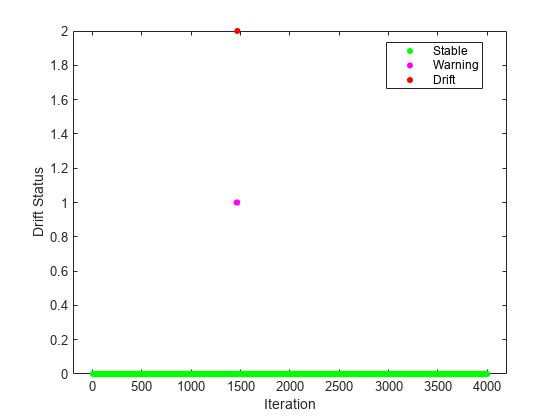
    Plot the drift status versus the iteration number.

    gscatter(1:numIterations,dstatus,statusname,'gmr','o',4,'on',"Iteration","Drift Status","Filled")

    Input Arguments

    collapse all

    Incremental drift-aware learning model fit to streaming data, specified as an incrementalDriftAwareLearner model object. You can create Mdl using the incrementalDriftAwareLearner function. For more details, see the object reference page.

    Chunk of predictor data to which the model is fit, specified as a floating-point matrix of n observations and Mdl.BaseLearner.NumPredictors predictor variables.

    When Mdl.BaseLearner accepts the ObservationsIn name-value argument, the value of ObservationsIn determines the orientation of the variables and observations. The default ObservationsIn value is "rows", which indicates that observations in the predictor data are oriented along the rows of X.

    The length of the observation responses (or labels) Y and the number of observations in X must be equal; Y(j) is the response (or label) of observation j (row or column) in X.

    Note

    • If Mdl.BaseLearner.NumPredictors = 0, updateMetrics infers the number of predictors from X, and sets the corresponding property of the output model. Otherwise, if the number of predictor variables in the streaming data changes from Mdl.BaseLearner.NumPredictors, updateMetrics issues an error.

    • updateMetrics supports only floating-point input predictor data. If your input data includes categorical data, you must prepare an encoded version of the categorical data. Use dummyvar to convert each categorical variable to a numeric matrix of dummy variables. Then, concatenate all dummy variable matrices and any other numeric predictors. For more details, see Dummy Variables.

    Data Types: single | double

    Chunk of responses (or labels) to which the model is fit, specified as one of the following:

    • Floating-point vector of n elements for regression models, where n is the number of rows in X.

    • Categorical, character, or string array, logical vector, or cell array of character vectors for classification models. If Y is a character array, it must have one class label per row. Otherwise, Y must be a vector with n elements.

    The length of Y and the number of observations in X must be equal; Y(j) is the response (or label) of observation j (row or column) in X.

    For classification problems:

    • When Mdl.BaseLearner.ClassNames is nonempty, the following conditions apply:

      • If Y contains a label that is not a member of Mdl.BaseLearner.ClassNames, updateMetrics issues an error.

      • The data type of Y and Mdl.BaseLearner.ClassNames must be the same.

    • When Mdl.BaseLearner.ClassNames is empty, updateMetrics infers Mdl.BaseLearner.ClassNames from data.

    Data Types: single | double | categorical | char | string | logical | cell

    Name-Value Arguments

    Specify optional pairs of arguments as Name1=Value1,...,NameN=ValueN, where Name is the argument name and Value is the corresponding value. Name-value arguments must appear after other arguments, but the order of the pairs does not matter.

    Example: ObservationsIn="columns",Weights=W specifies that the columns of the predictor matrix correspond to observations, and the vector W contains observation weights to apply during incremental learning.

    Predictor data observation dimension, specified as the comma-separated pair consisting of 'ObservationsIn' and 'columns' or 'rows'.

    updateMetrics supports ObservationsIn only if Mdl.BaseLearner supports ObservationsIn name-value argument.

    Data Types: char | string

    Chunk of observation weights, specified as a floating-point vector of positive values. updateMetrics weighs the observations in X with the corresponding values in Weights. The size of Weights must equal n, which is the number of observations in X.

    By default, Weights is ones(n,1).

    Example: Weights=w

    Data Types: double | single

    Output Arguments

    collapse all

    Updated incremental drift-aware learning model, returned as an incremental learning model object of the same data type as the input model Mdl, incrementalDriftAwareLearner.

    If the model is not warm, updateMetrics does not compute performance metrics. As a result, the Metrics property of Mdl remains completely composed of NaN values. If the model is warm, updateMetrics computes the cumulative and window performance metrics on the new data X and Y, and overwrites the corresponding elements of Mdl.Metrics. All other properties of the input model Mdl carry over to the output model Mdl. For more details, see Performance Metrics.

    Algorithms

    collapse all

    Performance Metrics

    • The updateMetrics and updateMetricsAndFit functions track model performance metrics (Metrics) from new data when the incremental model is warm (Mdl.BaseLearner.IsWarm property). An incremental model becomes warm after fit or updateMetricsAndFit fits the incremental model to MetricsWarmupPeriod observations, which is the metrics warm-up period.

      If Mdl.BaseLearner.EstimationPeriod > 0, the functions estimate hyperparameters before fitting the model to data. Therefore, the functions must process an additional EstimationPeriod observations before the model starts the metrics warm-up period.

    • The Metrics property of the incremental model stores two forms of each performance metric as variables (columns) of a table, Cumulative and Window, with individual metrics in rows. When the incremental model is warm, updateMetrics and updateMetricsAndFit update the metrics at the following frequencies:

      • Cumulative — The functions compute cumulative metrics since the start of model performance tracking. The functions update metrics every time you call the functions, and base the calculation on the entire supplied data set until a model reset.

      • Window — The functions compute metrics based on all observations within a window determined by the MetricsWindowSize name-value argument. MetricsWindowSize also determines the frequency at which the software updates Window metrics. For example, if MetricsWindowSize is 20, the functions compute metrics based on the last 20 observations in the supplied data (X((end – 20 + 1):end,:) and Y((end – 20 + 1):end)).

        Incremental functions that track performance metrics within a window use the following process:

        1. Store MetricsWindowSize amount of values for each specified metric, and store the same amount of observation weights.

        2. Populate elements of the metrics values with the model performance based on batches of incoming observations, and store the corresponding observation weights.

        3. When the window of observations is filled, overwrite Mdl.Metrics.Window with the weighted average performance in the metrics window. If the window is overfilled when the function processes a batch of observations, the latest incoming MetricsWindowSize observations are stored, and the earliest observations are removed from the window. For example, suppose MetricsWindowSize is 20, there are 10 stored values from a previously processed batch, and 15 values are incoming. To compose the length 20 window, the functions use the measurements from the 15 incoming observations and the latest 5 measurements from the previous batch.

    • The software omits an observation with a NaN prediction (score for classification and response for regression) when computing the Cumulative and Window performance metric values.

    Observation Weights

    For classification problems, if the prior class probability distribution is known (in other words, the prior distribution is not empirical), updateMetrics normalizes observation weights to sum to the prior class probabilities in the respective classes. This action implies that observation weights are the respective prior class probabilities by default.

    For regression problems or if the prior class probability distribution is empirical, the software normalizes the specified observation weights to sum to 1 each time you call updateMetrics.

    Version History

    Introduced in R2022b