ezcontourf
(Not recommended) Filled contour plotter
ezcontourf is not recommended. Use fcontour instead.
Description
ezcontourf( plots the
contour lines of f(x,y), where
f)f is a sym that represents a mathematical function
of two variables, such as x and y.
The function f is plotted over the default domain –2π < x < 2π, –2π < y < 2π. MATLAB® software chooses the computational grid according to the amount of variation that occurs; if the function f is not defined (singular) for points on the grid, then these points are not plotted.
ezcontourf automatically adds a title and axis labels.
ezcontourf(
plots f(x,y) over the specified
f,domain)domain. domain can be either a 4-by-1 vector
[xmin, xmax, ymin, ymax] or a 2-by-1 vector [min,
max] (where, min < x <
max, min < y <
max). If f is a function of the variables
u and v (rather than x and
y), then the domain endpoints umin,
umax, vmin, and vmax are sorted
alphabetically. Thus, ezcontourf(u^2 - v^3,[0,1],[3,6]) plots the contour
lines for u2 -
v3 over 0 < u < 1,
3 < v < 6.
ezcontourf(___,
plots f over the default domain using an
n)n-by-n grid. The default value for
n is 60.
Examples
Plot Filled Contours
The following mathematical expression defines a function of two variables, x and y.
ezcontourf requires a sym argument that
expresses this function using MATLAB syntax to represent exponents, natural logs, etc. This function is represented
by the symbolic expression
syms x y
f = 3*(1-x)^2*exp(-(x^2)-(y+1)^2)...
   - 10*(x/5 - x^3 - y^5)*exp(-x^2-y^2)...
   - 1/3*exp(-(x+1)^2 - y^2);
For convenience, this expression is written on three lines.
Pass the sym
f to ezcontourf along with a domain ranging from
-3 to 3 and specify a grid of 49-by-49.
ezcontourf(f,[-3,3],49)
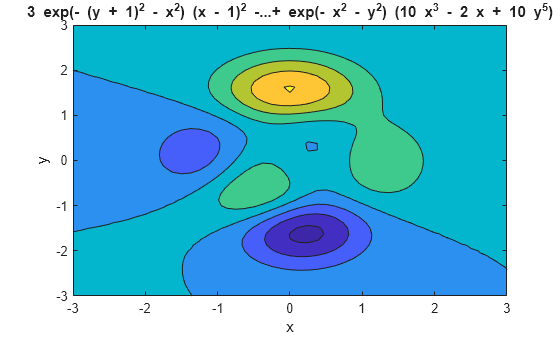
In this particular case, the title is too long to fit at the top of the graph so MATLAB abbreviates the title.
Input Arguments
Version History
Introduced before R2006a