Visualice la distribución de datos del canal con un diagrama de caja
Este ejemplo muestra cómo dibujar un diagrama de caja a partir de los datos de su canal ThingSpeak™ y visualizar la distribución de los datos.
Leer datos del canal ThingSpeak Car-Counter
El canal ThingSpeak 38629 contiene datos obtenidos con una Raspberry Pi™ y una cámara web que cuenta coches en una carretera muy transitada. El algoritmo de conteo de automóviles se ejecuta en Raspberry Pi y envía el conteo de automóviles cada 15 segundos a ThingSpeak. Los campos 1 y 2 contienen datos de tráfico en dirección este y oeste, respectivamente.
data = thingSpeakRead(38629,'NumDays',1,'Fields',[1,2],'outputFormat','table');
Dibujar un diagrama de caja
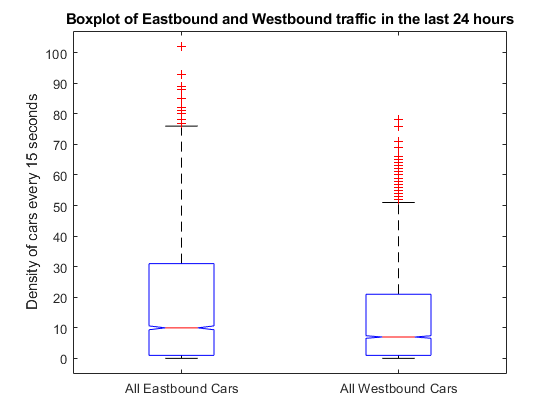
Visualice la distribución de los datos de tráfico en dirección este y oeste con la función de diagrama de caja que muestra el mínimo, el máximo, la mediana, el primer cuartil y el tercer cuartil.
boxplot([data.DensityOfEastboundCars data.DensityOfWestboundCars],'Notch','on', ...
    'Labels',{'All Eastbound Cars','All Westbound Cars'});
ylabel('Density of cars every 15 seconds');
title('Boxplot of Eastbound and Westbound traffic in the last 24 hours');

El diagrama de caja muestra la mediana, el número mínimo y máximo de automóviles para el tráfico en dirección este y oeste. Los bigotes cubren por defecto el 99,3 por ciento de los datos. La parte inferior y superior del cuadro indican el primer y tercer cuartil; la distribución del tráfico en dirección oeste es notablemente menor.
Consulte también
Funciones
boxplot(Statistics and Machine Learning Toolbox) |thingSpeakRead