selectUniform
Select uniformly distributed subset of point features
Syntax
Description
Examples
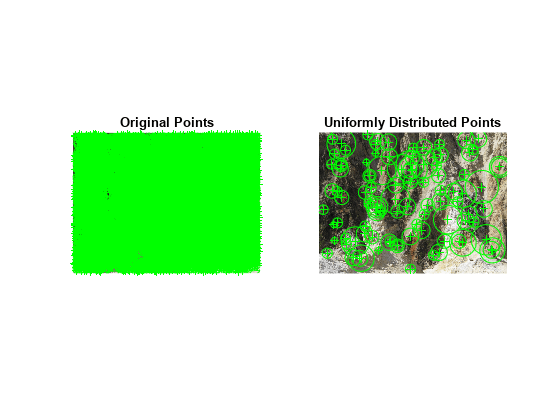
Read an image.
im = imread("yellowstone_left.png");Detect and display KAZE features.
points1 = detectKAZEFeatures(im2gray(im))
points1 =
  6713×1 KAZEPoints array with properties:

       Location: [6713×2 single]
         Metric: [6713×1 single]
          Count: 6713
          Scale: [6713×1 single]
    Orientation: [6713×1 single]
subplot(1,2,1)
imshow(im)
hold on
plot(points1)
hold off
title("Original Points")
Select a uniformly distributed subset of points.
numPoints = 100;
points2 = selectUniform(points1,numPoints,size(im))
points2 =
  100×1 KAZEPoints array with properties:

       Location: [100×2 single]
         Metric: [100×1 single]
          Count: 100
          Scale: [100×1 single]
    Orientation: [100×1 single]
subplot(1,2,2)
imshow(im)
hold on
plot(points2)
hold off
title("Uniformly Distributed Points")
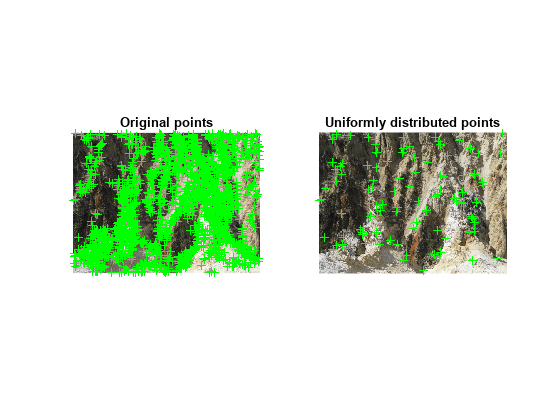
Load an image.
im = imread("yellowstone_left.png");Detect many corners by reducing the quality threshold.
points1 = detectHarrisFeatures(im2gray(im),MinQuality=0.05);
Plot image with detected corners.
subplot(1,2,1);
imshow(im);
hold on
plot(points1);
hold off
title("Original points");
Select a uniformly distributed subset of points.
numPoints = 100;
points2 = selectUniform(points1,numPoints,size(im));
Plot images showing original and subset of points.
subplot(1, 2, 2);
imshow(im);
hold on
plot(points2);
hold off
title("Uniformly distributed points");
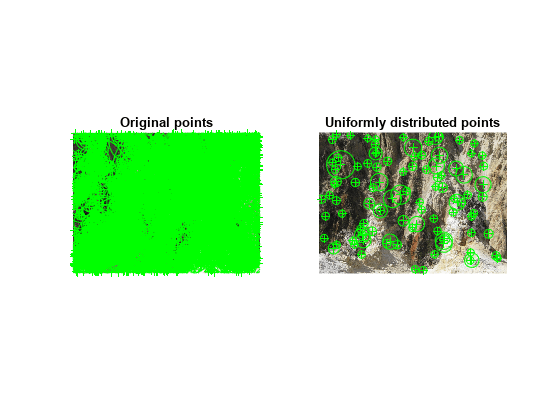
Load an image into the workspace.
im = imread("yellowstone_left.png");Detect many corners by reducing the quality threshold.
points1 = detectBRISKFeatures(im2gray(im),MinQuality=0.05);
Plot image with detected corners.
subplot(1,2,1);
imshow(im);
hold on
plot(points1);
hold off
title("Original points");
Select a uniformly distributed subset of points.
numPoints = 100;
points2 = selectUniform(points1,numPoints,size(im));
Plot images showing original and subset of points.
subplot(1, 2, 2);
imshow(im);
hold on
plot(points2);
hold off
title("Uniformly distributed points");
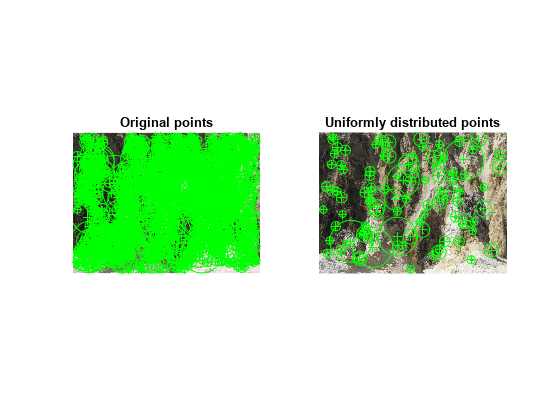
Load an image.
im = imread("yellowstone_left.png");Detect and display SURF features.
points1 = detectSURFFeatures(im2gray(im));
subplot(1,2,1);
imshow(im);
hold on
plot(points1);
hold off
title("Original points");
Select a uniformly distributed subset of points.
numPoints = 100;
points2 = selectUniform(points1,numPoints,size(im));
Plot images showing original and subset of points.
subplot(1, 2, 2);
imshow(im);
hold on
plot(points2);
hold off
title("Uniformly distributed points");