Contenido principal

nodePositionGrid

Generate node positions within rectangular grid

Since R2026a

    Description

    The nodePositionGrid function generates node positions in a grid or within a given polygon. It can divide a specified area into a grid of rectangular cells, placing a serving node such as a next generation NodeB (gNB), access point (AP), or Central node in each cell and returning a vector of polyshape objects, with each object representing a cell. You can then use this vector of polyshape objects as an input to the nodePositionGrid function again to place served nodes such as user equipment (UE) node, Station node, and Peripheral node within each cell.

    Generate Node Positions in Grid

    [nodePosition,polygonShapeOut] = nodePositionGrid(boundaryDimension) generates a node position at the center of a rectangle with the specified dimensions boundaryDimension. The rectangle is centered at the origin.

    [nodePosition,polygonShapeOut] = nodePositionGrid(boundaryDimension,Name=Value) sets the node position configuration parameters using one or more optional name-value arguments. PlacementType="center" generates node positions at the center of each cell of the grid within the specified boundary.

    Generate Node Positions in Polygonal Area

    [nodePosition,polygonShapeOut] = nodePositionGrid(polygonShapeIn) generates a node position within the rectangular boundary specified by the polygon polygonShapeIn.

    [nodePosition,polygonShapeOut] = nodePositionGrid(polygonShapeIn,Name=Value)sets the node position configuration parameters using one or more optional name-value arguments. For example, NumNodesPerCell=2 specifies to place two nodes within the specified boundary.

    Examples

    collapse all

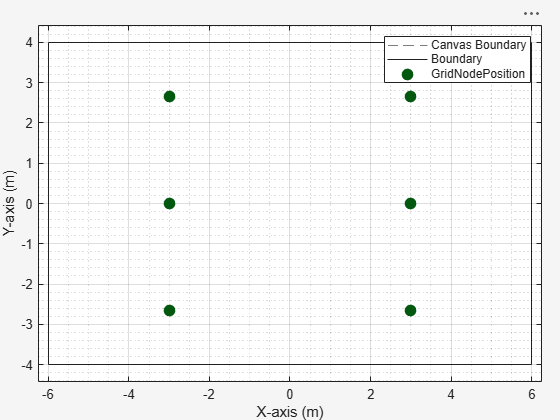
    Generate and visualize a grid placement of wireless nodes within a rectangular area. Using the nodePositionGrid function, place six nodes in a 3-by-2 grid inside a 12-by-8 meter region, centered at (0, 0). Then, use wirelessNetworkViewer to display the resulting node positions.

    Set the area dimensions, center, and grid size of the placement area.

    areaLength = 12;            % Rectangle length (meters)
    areaWidth = 8;              % Rectangle width (meters)
    centerCoord = [0 0 0];      % Center of rectangle (x, y, z)
    gridRows = 3;               % Number of rows
    gridCols = 2;               % Number of columns
    zCoord = 2;                 % z-coordinate for all nodes

    Generate node positions in the rectangle using a grid.

    [nodePosition,polygonShapeOut] = nodePositionGrid([areaLength areaWidth], ...
        Center=centerCoord, ...
        GridSize=[gridRows gridCols], ...
        ZCoordinate=zCoord);

    Visualize the positions using the wireless network viewer.

    viewer = wirelessNetworkViewer(CanvasSize=[12 8]);
    addNodes(viewer,nodePosition,Type="GridNodePosition")

    Show the rectangular boundary.

    showBoundary(viewer, ...
        Position=centerCoord, ...
        BoundaryShape="rectangle", ...
        Bounds=[areaLength areaWidth], ...
        Name="RectangleBoundary")

    Figure Wireless Network Viewer contains an axes object. The axes object with xlabel X-axis (m), ylabel Y-axis (m) contains 14 objects of type line. One or more of the lines displays its values using only markers These objects represent Canvas Boundary, GridNodePosition, Boundary.

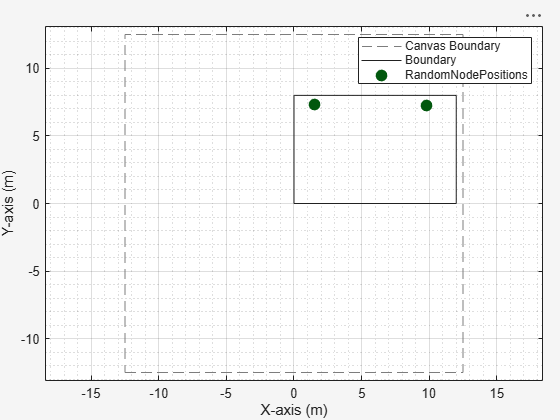
    Place wireless nodes randomly within a polygonal area using nodePositionGrid. Then, visualize the node positions and the polygon boundary by using wirelessNetworkViewer.

    Define the polygonal region.

    polygonShapeIn = polyshape([0 0 12 12], [0 8 8 0]);

    Generate node positions.

    [nodePosition, polygonShapeOut] = nodePositionGrid(polygonShapeIn, ...
        NumNodesPerCell=2, ...
        PlacementType="random", ...
        ZCoordinate=2);

    View the positions using the wireless network viewer.

    viewer = wirelessNetworkViewer(CanvasSize=[25 25]);
    addNodes(viewer,nodePosition,Type="RandomNodePositions");

    Show the boundary.

    showBoundary(viewer, ...
        Position=[6 4 0], ...           % Center of the rectangle (x, y, z)
        BoundaryShape="rectangle", ...
        Bounds=[12 8], ...              % Rectangle length and width
        Name="PolygonBoundary");

    Figure Wireless Network Viewer contains an axes object. The axes object with xlabel X-axis (m), ylabel Y-axis (m) contains 6 objects of type line. One or more of the lines displays its values using only markers These objects represent Canvas Boundary, RandomNodePositions, Boundary.

    Input Arguments

    collapse all

    Dimensions of the rectangular boundary, specified as a two-element vector. The first element specifies the length, and the second element specifies the width, of the rectangular boundary around the center coordinates Center. Units are in meters.

    Data Types: double | single

    Polygonal shapes defining the rectangular boundary, specified as an N-element vector of polyshape objects. Each shape must be two-dimensional. You can supply the vertices of the rectangle either in a clockwise or anticlockwise direction.

    Name-Value Arguments

    collapse all

    Specify optional pairs of arguments as Name1=Value1,...,NameN=ValueN, where Name is the argument name and Value is the corresponding value. Name-value arguments must appear after other arguments, but the order of the pairs does not matter.

    Example: nodePositionGrid(boundaryDimension,ZCoordinate=3.5) sets the z-coordinate for node positions to 3.5 meters.

    Center coordinates of the boundary, specified as a two-element row vector, three-element row vector, N-by-2 matrix, or N-by-3 matrix. Units are in meters.

    Note that this behavior is particularly useful in scenarios where you want to generate served nodes within a boundary centered around the serving node. For example, you can pass the position of a 5G base station, created with the nrGNB (5G Toolbox) object, as the center to the nodePositionGrid function. With this approach, you can generate user equipment node positions within a boundary centered on the base station. Wireless network simulations often represent node positions as 3-D Cartesian coordinates: [x, y, z]. By allowing the Center argument to accept a three-element vector, you can use these positions directly without extracting only [x, y]. For example, you can set Center = [50 50 10]. The function ignores the third value.

    Note

    This name-value argument applies only when you provide boundaryDimension as the first input argument.

    Data Types: double | single

    Number of rows and columns in the grid, specified as a row vector of integers. The first element specifies the number of rows and the second element specifies the number of columns.

    Note

    This name-value argument applies only when you provide boundaryDimension as the first input argument.

    Data Types: double | single

    Distance between nodes along X-axis, specified as a positive scalar. Units are in meters.

    When you specify XDelta or YDelta, the function uses these values to control the horizontal (XDelta) and vertical (YDelta) spacing between adjacent nodes and the edges of the rectangle. To maintain this spacing, the function defines an effective node placement area inside the rectangle. This area is less than or equal to the total area of the rectangle because the function excludes marginal areas, which are strips along the edges where it does not place any nodes, ensuring the required spacing from the boundary.

    Note that when you provide XDelta, it overrides the PlacementType name-value argument.

    Note

    This name-value argument applies only when you provide boundaryDimension as the first input argument.

    Distance between nodes along Y-axis, specified as a positive scalar. Units are in meters.

    When you specify XDelta or YDelta, the function uses these values to control the horizontal (XDelta) and vertical (YDelta) spacing between adjacent nodes and the edges of the rectangle. To maintain this spacing, the function defines an effective node placement area inside the rectangle. This area is less than or equal to the total area of the rectangle because the function excludes marginal areas, which are strips along the edges where it does not place any nodes, ensuring the required spacing from the boundary.

    Note that when you provide YDelta, it overrides the PlacementType name-value argument.

    Note

    This name-value argument applies only when you provide boundaryDimension as the first input argument.

    Data Types: double | single

    Number of node positions per grid cell, specified as a positive integer. The value of NumNodesPerCell must be 1 for placement types other than"random", or when you specify XDelta or YDelta.

    Data Types: double | single

    Placement type for nodes within each cell, specified as "center", "bottom-left", or "random".

    The function ignores the PlacementType argument when you specify XDelta or YDelta.

    z-coordinate for node positions, specified as a numeric scalar. Units are in meters.

    Data Types: double | single

    Output Arguments

    collapse all

    Generated node positions, returned as a three-element row vector or N-by-3 matrix. Each row of nodePosition contains the Cartesian coordinates [X, Y, Z] of a node. N is the number of nodes generated.

    This table shows how the output size of nodePosition from nodePositionGrid changes according to input arguments you specify.

    Input ArgumentsOutput Size of nodePositionDescription
    boundaryDimension, GridSize=[m n] and NumNodesPerCell=p (m × n × p)-by-3Nodes placed in a grid with m rows, n columns, and p nodes per cell.
    polygonShapeIn, NumNodesPerCell=p (N × p)-by- 3p nodes per polygon, where N is the total number of polygons.

    Cell boundary information, returned as a vector of polyshape objects. This table shows how the size of polygonShapeOut depends on whether you generate nodes in a grid or in a polygon.

    CaseOutput Size of polygonShapeOutDescription
    Grid1-by-MA vector of polyshape objects, where M is the total number of cells in the grid. Each element corresponds to a grid cell and defines its boundary.
    Polygon 1-by-NA vector of polyshape objects, where N is the number of polygons.

    Version History

    Introduced in R2026a