wirelessTrafficViewer
Description
Use the wirelessTrafficViewer object to view the state
transitions and channel occupancy of wireless nodes. This object visualizes packet
communication across time for each node, and visualizes the frequency usage of all the packets
communicated across time by all the nodes.
Creation
Syntax
Description
trafficViewer = wirelessTrafficViewer creates a default wireless
traffic viewer object, which visualizes packet communications during the runtime of a
wireless network simulation.
trafficViewer = wirelessTrafficViewer(
sets properties using one or more optional name-value arguments. For example,
PropertyName=Value)RefreshRate=5 sets the refresh rate of the viewer to
5.
Properties
Object Functions
addNodes | Add wireless nodes to wireless traffic viewer |
Examples
Initialize a wireless network simulator, then create and configure both an access point (AP) node and a station (STA) node. After associating the STA with the AP, you add both nodes to the simulation. Next, you set up a wireless traffic viewer for visualization and run the simulation to observe the state transitions and channel occupancy of the wireless nodes.
Initialize the wireless network simulator.
networkSimulator = wirelessNetworkSimulator.init;
Create and configure the AP node.
deviceCfg = wlanDeviceConfig(Mode="AP");
apNode = wlanNode(Name="AP",Position=[0 10 0],DeviceConfig=deviceCfg);
Create the STA node with a default device configuration.
staNode = wlanNode(Name="STA",Position=[5 0 0]);Associate the STA node with the AP node.
associateStations(apNode,staNode,FullBufferTraffic="on")Add the nodes to the simulator.
addNodes(networkSimulator,[apNode staNode])
Create a wireless traffic viewer and add the nodes to it.
wirelessTrafficVis = wirelessTrafficViewer;
addNodes(wirelessTrafficVis,[apNode staNode])
Set the simulation time, and run the simulation.
simulationTime = 0.2;
run(networkSimulator,simulationTime)
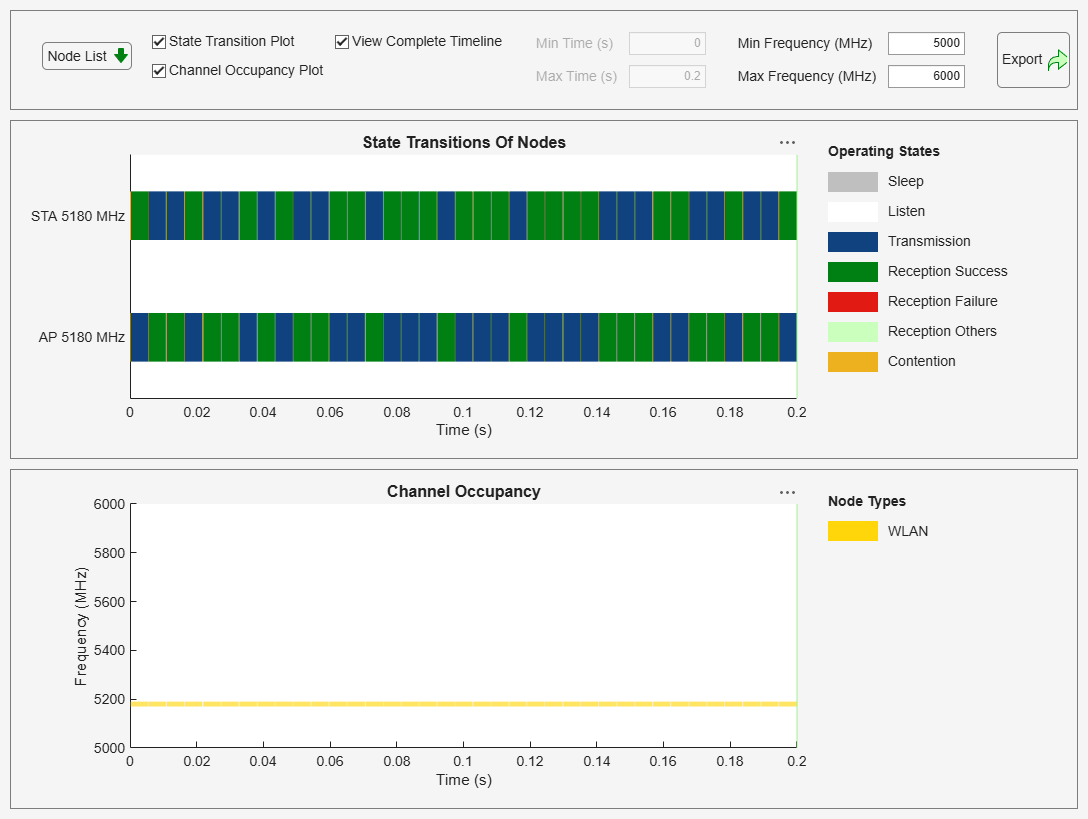
Try exploring these additional features of the wireless traffic viewer:
Disable and enable nodes from plots.
Disable and enable operating states and node types.
Visualize certain time and frequency durations.
Export images.
Simulate a Bluetooth® Low Energy (LE) network to observe the state transitions and channel occupancy of Bluetooth nodes. Initialize the wireless network simulator, create and connect a Central and a Peripheral node, and configure On-Off traffic. After adding the nodes to the simulator and the wireless traffic viewer, run the simulation and visualize node activity.
Initialize the wireless network simulator.
networkSimulator = wirelessNetworkSimulator.init;
Set simulation time.
simulationTime = 0.2;
Create a Central and PeripheralBluetooth LE node.
centralNode = bluetoothLENode("central",Position=[0 0 0]);
peripheralNode = bluetoothLENode("peripheral",Position=[1 0 0]);
Create and configure the connection between the nodes.
cfg = bluetoothLEConnectionConfig;
configureConnection(cfg,centralNode,peripheralNode);
Configure On-Off traffic.
traffic = networkTrafficOnOff(DataRate=200,PacketSize=27,OnTime=Inf,OffTime=0);
Add traffic sources.
addTrafficSource(centralNode,traffic,DestinationNode=peripheralNode)
Add the nodes to the simulator.
nodes = [centralNode peripheralNode];
addNodes(networkSimulator,nodes)
Create a wireless traffic viewer and add the nodes to it.
wirelessTrafficVis = wirelessTrafficViewer;
addNodes(wirelessTrafficVis,nodes)
Run the simulation.
run(networkSimulator,simulationTime)
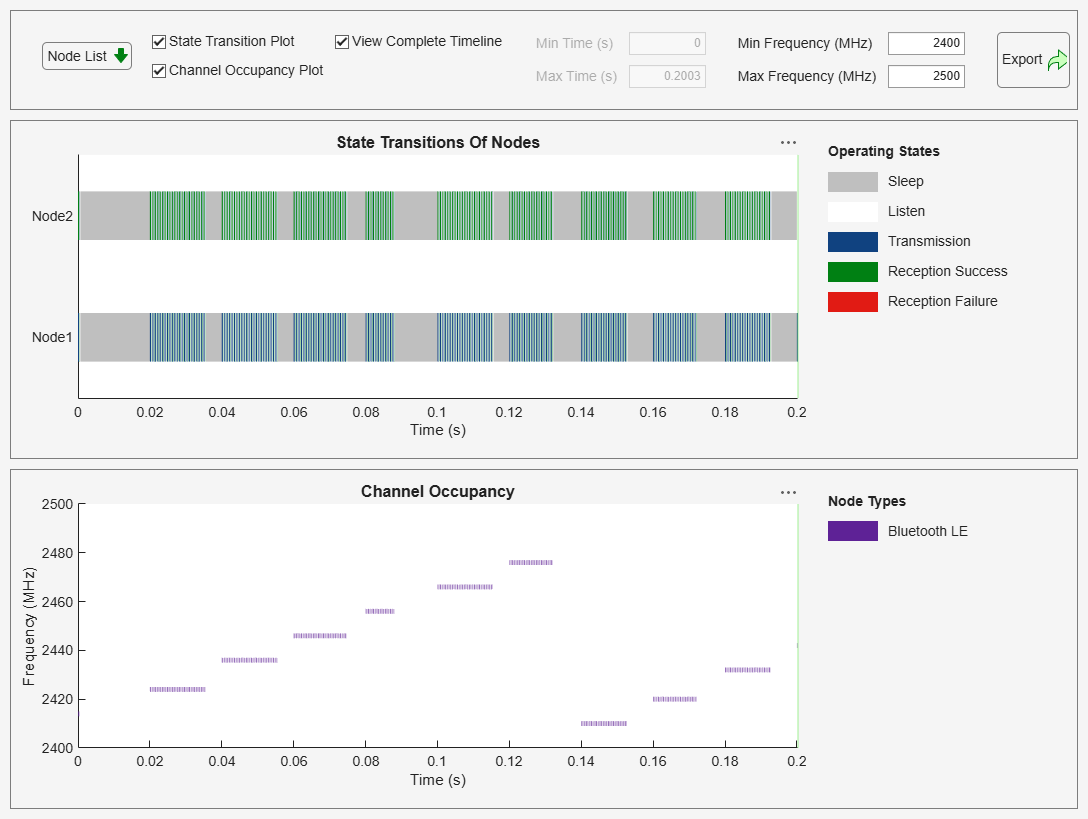
Try exploring these additional features of the wireless traffic viewer:
Disable and enable nodes from plots.
Disable and enable operating states and node types.
Visualize certain time and frequency durations.
Export images.
More About
This section outlines the features of the Traffic Viewer.
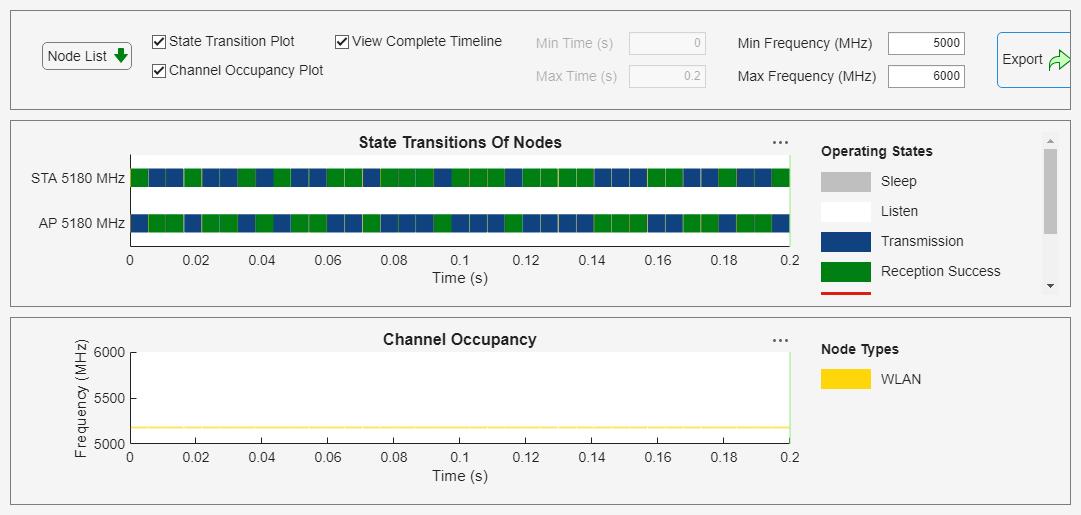
Node List — Show or hide state transitions of nodes plot in the traffic viewer
State Transition Plot — Show or hide state transitions of specific nodes in the traffic viewer.
Channel Occupancy Plot — Show or hide channel occupancy plot in the traffic viewer.
View Complete Timeline — Toggle full timeline view.
Min Time (S) and Max Time (s)— Set custom time range for view in the traffic viewer
Operating States — Show or hide operating states (such as Sleep, Idle, Transmission) via state transition plot legends.
Node Types — Show or hide nodes based on the technology type via channel occupancy plot legends.
Plot Controls — Zoom, pan, or export plots using the axis toolbar available at the right corner of the plots.
Min Freq (MHz) and Max Freq (MHz) — Set a custom frequency range in MHz for viewing in the traffic viewer.
View All Nodes — Toggle the full list of nodes view. When you add more than 10 nodes to the traffic viewer, use this option to view all nodes. Additionally, use the vertical scrollbar to the left of the State Transition Plot to adjust the number of nodes displayed.
Export — Export the current snip of traffic viewer to an image at the desired location.
Version History
Introduced in R2026a
See Also
Objects
wlanNode(WLAN Toolbox) |bluetoothLENode(Bluetooth Toolbox) |wirelessNetworkSimulator
Topics
- Simulate and Visualize Network Traffic and Log Events (Bluetooth Toolbox)