Capture and Label NR and LTE Signals for AI Training
This example shows how to scan, capture, and label bandwidths with 5G NR and LTE signals using an NI™ USRP™ software-defined radio (SDR). The example scans a wide bandwidth to determine 5G NR and LTE primary synchronization signal (PSS) locations, and then captures and interactively labels the bandwidth of the associated carrier waveforms and any unknown signals.
Associated AI for Wireless Examples
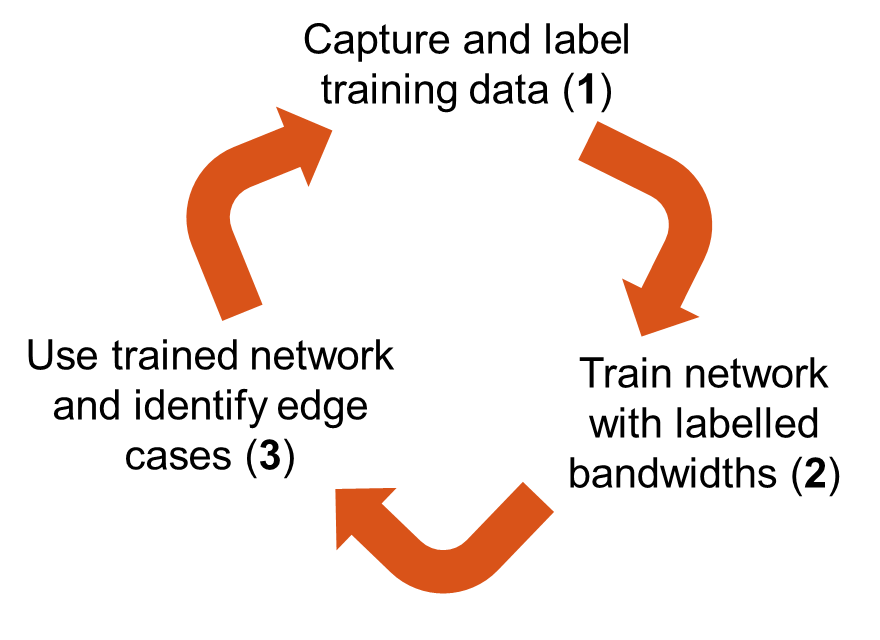
Use this example as part of a deep learning workflow:
Use this example to scan, capture, and label bandwidths with 5G NR and LTE signals using an SDR.
Use the Spectrum Sensing with Deep Learning to Identify 5G, LTE, and WLAN Signals example to train a semantic segmentation network to identify 5G NR and LTE signals in a wideband spectrogram.
Use the Identify LTE and NR Signals from Captured Data Using SDR and Deep Learning example to use a deep learning trained semantic segmentation network to identify NR and LTE signals from wireless data captured with an SDR.
This diagram shows the complete workflow.
Introduction
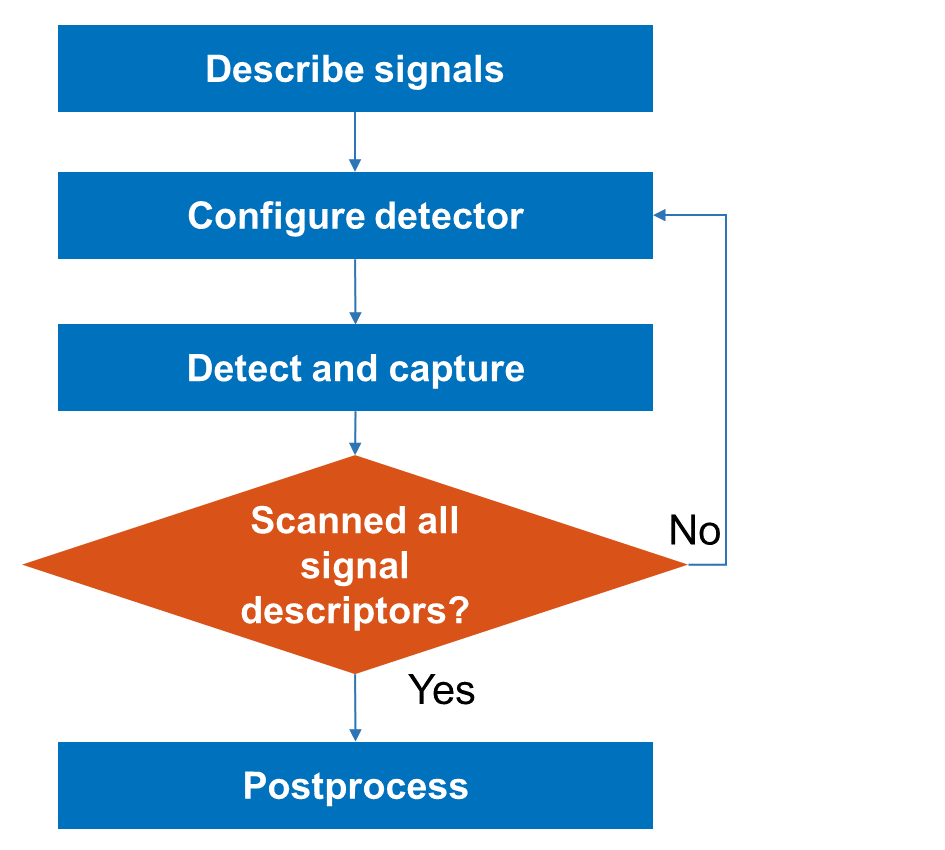
In this example, you use hNRPSSDescriptor and hLTEPSSDescriptor helper objects to describe 5G NR and LTE signal PSS signals that you want to detect and capture. Using the configureDetector helper function, you then configure an SDR preamble detector to scan for each signal by setting the following parameters:
Center frequency
Sample rate
Preamble
Trigger Offset
After you detect the signals, you capture the full bandwidth and postprocess the data by labeling each associated carrier waveform. This diagram shows the workflow.
Set Up Radio
Call the radioConfigurations function. The function returns all available radio setup configurations that you saved using the Radio Setup wizard.
savedRadioConfigurations = radioConfigurations;
To update the dropdown menu with your saved radio setup configuration names, click Update. Then select the radio to use with this example.
savedRadioConfigurationNames = [string({savedRadioConfigurations.Name})];
radio = savedRadioConfigurationNames(1) ;
;Choose Bandwidths to Capture and Label
Set the center frequencies and bandwidth of the captures. Use the hMaxBandwidth helper function to set the bandwidth to the maximum bandwidth of your radio.
centerFrequencies = [2600e6,3550e6];
bandwidth = hMaxBandwidth(radio);
[2600e6,3550e6];
bandwidth = hMaxBandwidth(radio);Describe Wireless Signals
Describe the 5G NR and LTE PSS that might be present in each bandwidth. Use the hNRPSSDescriptorsInFrequencyBand and hLTEPSSDescriptorsInFrequencyBand helper functions to create hNRPSSDescriptor and hLTEPSSDescriptor helper objects, respectively, according to the expected signal locations in the standard.
captureBandwidths = [];
numPotentialSignals = 0;
for cf = centerFrequencies
    wsds = [hNRPSSDescriptorsInFrequencyBand(cf-bandwidth/2,cf+bandwidth/2),...
        hLTEPSSDescriptorsInFrequencyBand(cf-bandwidth/2,cf+bandwidth/2)];
    captureBandwidths = [captureBandwidths, struct(CenterFrequency=cf,Bandwidth=bandwidth,SignalDescriptors=wsds)];
    numPotentialSignals = numPotentialSignals+length(wsds);
end
Configure and Tune Radio as Preamble Detector
Configure Preamble Detector
Create a preambleDetector object with the specified radio. Because the object requires exclusive access to radio hardware resources, clear any other object associated with the specified radio.
if ~exist("pd","var")
    clear bbrx
    pd = preambleDetector(radio);
end
To update the dropdown menu with the antennas available for capture on your radio, call the hCaptureAntennas helper function. Then select the antenna to use with this example.
captureAntennaSelection = hCaptureAntennas(radio);
pd.Antennas = captureAntennaSelection(1);
Tune Preamble Detector
Set the adaptive threshold gain, the adaptive threshold offset, and the radio gain values of the preamble detector for the local environment. You can calibrate these values by exploring the trigger points that the plotThreshold function provides. For more information, see Triggered Capture Using Preamble Detection.
pd.ThresholdMethod = "adaptive"; pd.AdaptiveThresholdGain =0.3; pd.AdaptiveThresholdOffset =
0.1; pd.RadioGain =
30;
Scan for Wireless Signals
Use the configureDetector helper function to configure the preamble detector with an appropriate preamble, trigger offset, sample rate and center frequency. Set the detection timeout to 20 milliseconds, which is the expected periodicity of a 5G NR SSB. Then use the capture function to detect and capture the described NR or LTE signal. If the detection is successful, save the detected signal descriptor. For large bands, the scan takes some time.
wb = hCaptureWaitBar(numPotentialSignals); for lb = 1:length(captureBandwidths) detectedSignals = []; for wsd = captureBandwidths(lb).SignalDescriptors hUpdateCaptureWaitBar(wb,wsd) pd = configureDetector(wsd,pd); [~,~,~,status] = capture(pd,1,milliseconds(20)); if status % Signal detected detectedSignals = [detectedSignals,wsd]; disp("Detected "+string(class(wsd))+" at "+string(wsd.CenterFrequency/1e6)+" MHz") end end % Update labeled bandwidth structure with only detected signals captureBandwidths(lb).SignalDescriptors=detectedSignals; end
Loading bitstream to FPGA...
Loading bitstream to FPGA is now complete.
Detected hLTEPSSDescriptor at 806 MHz
Detected hLTEPSSDescriptor at 805.7 MHz
Detected hLTEPSSDescriptor at 805.8 MHz
Detected hLTEPSSDescriptor at 805.9 MHz
Detected hLTEPSSDescriptor at 806 MHz
Detected hLTEPSSDescriptor at 806.1 MHz
Detected hLTEPSSDescriptor at 806.2 MHz
Detected hLTEPSSDescriptor at 806.3 MHz
Detected hLTEPSSDescriptor at 816 MHz
Detected hNRPSSDescriptor at 2647.45 MHz
Detected hLTEPSSDescriptor at 2662.9 MHz
Detected hLTEPSSDescriptor at 2679.7 MHz
Detected hLTEPSSDescriptor at 2679.8 MHz
Detected hLTEPSSDescriptor at 2679.9 MHz
Detected hLTEPSSDescriptor at 2680 MHz
Detected hLTEPSSDescriptor at 2680.1 MHz
Detected hLTEPSSDescriptor at 2680.2 MHz
Detected hLTEPSSDescriptor at 2680.3 MHz
Detected hLTEPSSDescriptor at 2629.7 MHz
Detected hLTEPSSDescriptor at 2630 MHz
Detected hNRPSSDescriptor at 2159.05 MHz
Detected hLTEPSSDescriptor at 2161.6 MHz
Detected hLTEPSSDescriptor at 2161.9 MHz
Detected hLTEPSSDescriptor at 2162 MHz
Detected hLTEPSSDescriptor at 2162.1 MHz
Detected hLTEPSSDescriptor at 2162.2 MHz
Detected hLTEPSSDescriptor at 2162.3 MHz
Detected hLTEPSSDescriptor at 2162.4 MHz
Detected hLTEPSSDescriptor at 2162.5 MHz
Detected hLTEPSSDescriptor at 2119.5 MHz
Detected hLTEPSSDescriptor at 2119.6 MHz
Detected hLTEPSSDescriptor at 2119.7 MHz
Detected hLTEPSSDescriptor at 2119.8 MHz
Detected hLTEPSSDescriptor at 2120 MHz
Detected hLTEPSSDescriptor at 2120.1 MHz
Detected hLTEPSSDescriptor at 2129.6 MHz
Detected hLTEPSSDescriptor at 2129.7 MHz
Detected hLTEPSSDescriptor at 2129.9 MHz
Detected hLTEPSSDescriptor at 1807.6 MHz
Detected hLTEPSSDescriptor at 1807.9 MHz
Detected hLTEPSSDescriptor at 1846.1 MHz
Detected hLTEPSSDescriptor at 1846.1 MHz
Detected hLTEPSSDescriptor at 1846.4 MHz
Detected hLTEPSSDescriptor at 1846.5 MHz
Detected hLTEPSSDescriptor at 1846.6 MHz
Detected hLTEPSSDescriptor at 1846.6 MHz
Detected hLTEPSSDescriptor at 1846.7 MHz
Detected hLTEPSSDescriptor at 1846.8 MHz
Detected hLTEPSSDescriptor at 1846.8 MHz
Detected hLTEPSSDescriptor at 1846.9 MHz
Detected hLTEPSSDescriptor at 1847 MHz
Detected hLTEPSSDescriptor at 1847.3 MHz
Detected hLTEPSSDescriptor at 1865.9 MHz
Detected hLTEPSSDescriptor at 1866.2 MHz
Detected hLTEPSSDescriptor at 1866.3 MHz
Detected hLTEPSSDescriptor at 1866.3 MHz
Detected hLTEPSSDescriptor at 1866.4 MHz
Detected hLTEPSSDescriptor at 1866.5 MHz
Detected hLTEPSSDescriptor at 1866.6 MHz
Detected hLTEPSSDescriptor at 1866.7 MHz
Detected hLTEPSSDescriptor at 1866.8 MHz
Detected hLTEPSSDescriptor at 1866.8 MHz
Detected hLTEPSSDescriptor at 1807.6 MHz
Detected hLTEPSSDescriptor at 1846.7 MHz
Detected hLTEPSSDescriptor at 1860.8 MHz
Detected hLTEPSSDescriptor at 1861 MHz
Detected hLTEPSSDescriptor at 1861.1 MHz
Detected hLTEPSSDescriptor at 1861.1 MHz
Detected hLTEPSSDescriptor at 1861.2 MHz
Detected hLTEPSSDescriptor at 1861.3 MHz
Detected hLTEPSSDescriptor at 1861.3 MHz
Detected hLTEPSSDescriptor at 1861.4 MHz
Detected hLTEPSSDescriptor at 942.4 MHz
Detected hLTEPSSDescriptor at 952.5 MHz
close(wb)
Configure Radio as Baseband Receiver
Configure Baseband Receiver
Create a basebandReceiver object with the specified radio. Clear any other object associated with the specified radio.
if ~exist("bbrx","var")
    clear pd
    bbrx = basebandReceiver(radio);
end
To update the dropdown menu with the antennas available for capture on your radio, call the hCaptureAntennas helper function. Then select the number of antennas to capture with. Use the dropdown menus to select the individual antennas.
captureAntennaSelection = hCaptureAntennas(radio); numAntennas = string(1:length(captureAntennaSelection)); numCaptureAntennas =numAntennas(1); % Number of antennas to capture with selectedAntennas =
captureAntennaSelection(1); % First antenna if str2double(numCaptureAntennas)>=2 selectedAntennas(2) =
captureAntennaSelection(1); % Second antenna end if str2double(numCaptureAntennas)>=3 selectedAntennas(3) =
captureAntennaSelection(1); % Third antenna end if str2double(numCaptureAntennas)>=4 selectedAntennas(4) =
captureAntennaSelection(1); % Fourth antenna end bbrx.Antennas = selectedAntennas;
Tune Baseband Receiver
Set the radio gain value of the baseband receiver for the local environment. For more information, see Calibrate Radio Gain for Signal Capture.
bbrx.RadioGain =  30;
30;Capture Bandwidths to Label
Configure the baseband receiver with an appropriate sample rate and center frequency. Set the sample rate to a value greater than the bandwidth. Use the hMaxSampleRate helper function to set the sample rate to the maximum sample rate of your radio. Then use the capture function to capture 200 milliseconds of data, which corresponds to five frames of training data in the Spectrum Sensing with Deep Learning to Identify 5G, LTE, and WLAN Signals example.
bbrx.SampleRate=hMaxSampleRate(radio); for lb = 1:length(captureBandwidths) bbrx.CenterFrequency=captureBandwidths(lb).CenterFrequency; [captureBandwidths(lb).Data,captureBandwidths(lb).Timestamp] = capture(bbrx,milliseconds(200)); captureBandwidths(lb).SampleRate = bbrx.SampleRate; end
Loading bitstream to FPGA...
Loading bitstream to FPGA is now complete.
Plot Captured Data and Label Signal Bandwidth
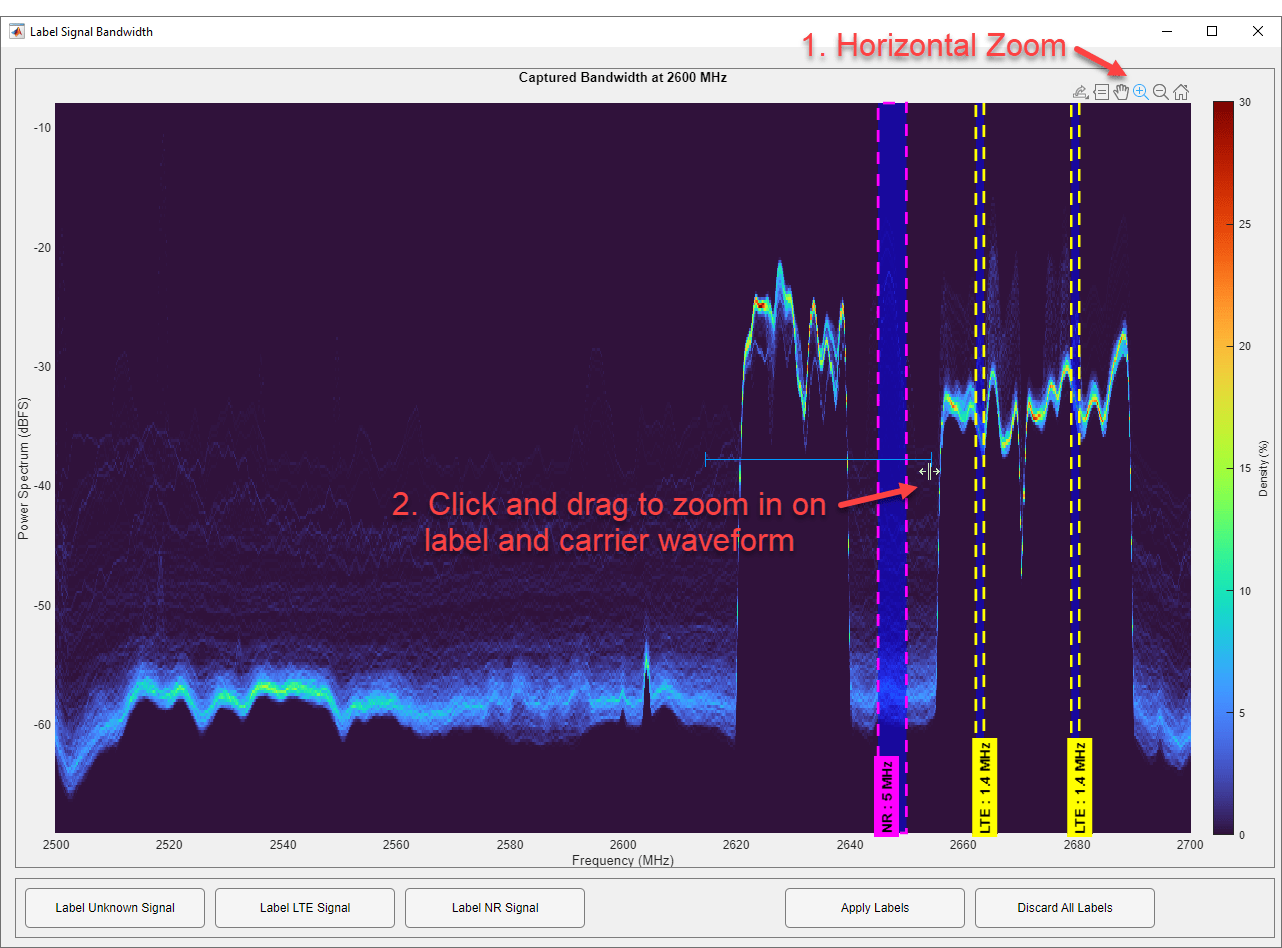
Use the hLabelBandwidth helper function to plot a persistence spectrum and interactively label the data from the first antenna at each bandwidth. For information about the hLabelBandwidth helper function, see Implement Interactive Labeling Function.
A label, represented by a shaded rectangle on the plot, is added for each NR and LTE signal detected during the scan for wireless signals step. Each rectangle is centered on the center frequency where it was detected and has a bandwidth equal to the minimum expected bandwidth for the standard.
In some cases, depending on the tuning of the preamble detector, the same LTE signal might be detected with small frequency offsets. The hLabelBandwidth helper function filters any detections of the same signal type within the minimum bandwidth according to the signal standard.
for lb = 1:length(captureBandwidths)
    % Label bandwidth
    captureBandwidths(lb).Labels = hLabelBandwidth(captureBandwidths(lb));
Label 5G NR Carrier Waveforms
Due to the flexibility of the 5G NR standard, any detected 5G NR PSS indicates the presence of an SSB, but does not indicate the center of the carrier waveform. To precisely manipulate the label location and bandwidth, first select the horizontal zoom control from the axis, then zoom in on the waveform and NR label.
Move the generated label to one edge of the carrier waveform by clicking in the center of the label, moving the cursor to the edge of the waveform, and clicking again to release.
If the detected NR SSB has no associated carrier waveform, the signal is obscured by noise, or the detection is a false positive, right click on a label to delete it.

Then click on an edge of the label, move the cursor to include the full carrier waveform, and click again to release. The bandwidth of the label snaps to the nearest width described in the standard.

Label LTE Carrier Waveforms
Any detected LTE PSS are in the center of an LTE carrier waveform. Click and move each edge so that the label includes the carrier waveform.
Label Unknown Waveforms
Finally, label any visible signals that are not NR or LTE as "Unknown". To do this, click the Label Unknown Signals button, then click on one edge of the unknown signal.
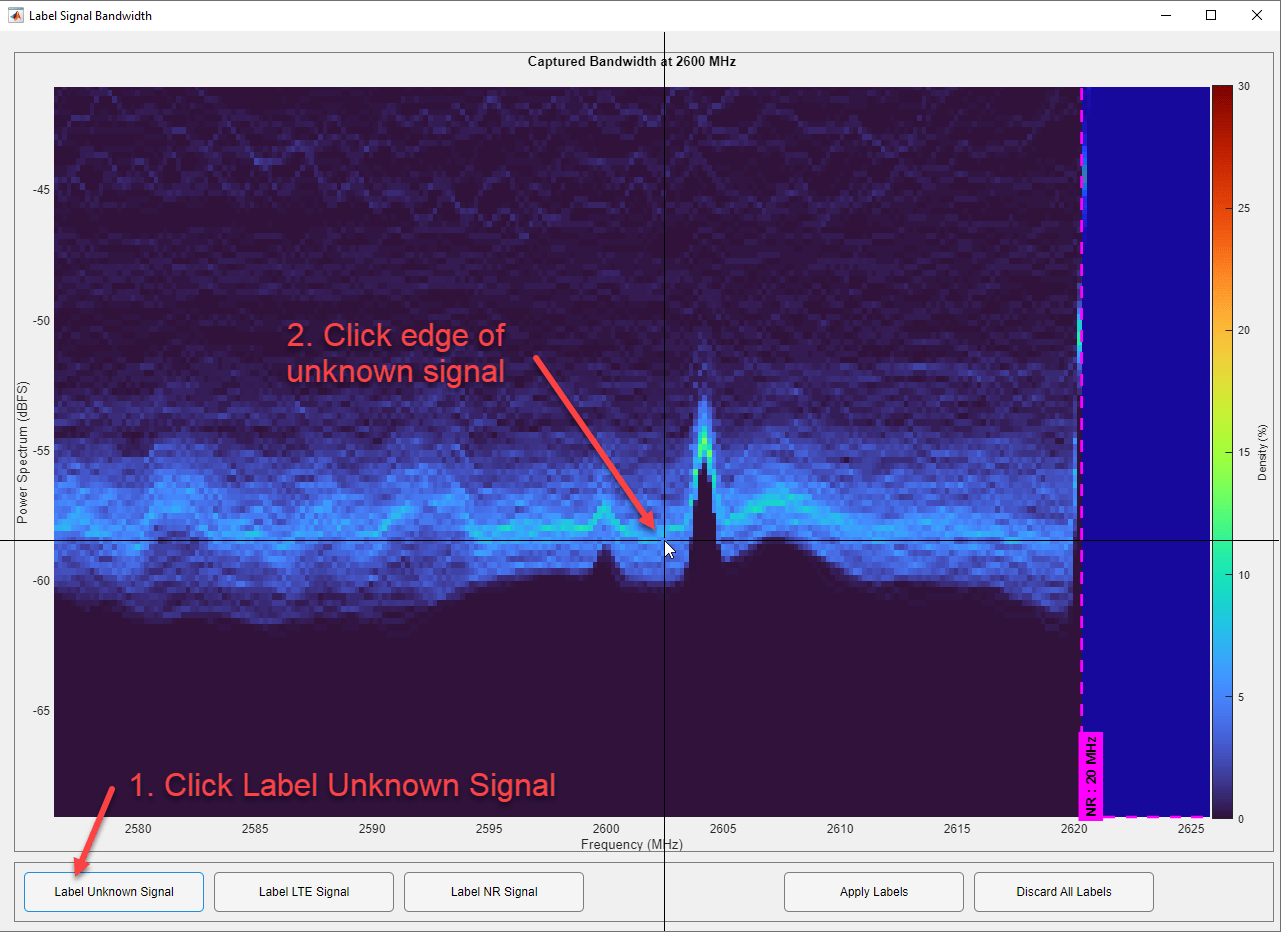
To apply the label, click on the other edge of the signal.

Apply Labels and Save
When you have labeled all of the signals, click the Apply Labels button to return a table of the labeled signals and close the figure. Save the bandwidth and labels to a file. Repeat for all captured bandwidths.

To implement the hLabelBandwidth helper function, see Implement Interactive Labeling Function.
    % Save to file
    labeledBandwidth = captureBandwidths(lb);
    fname = "CF"+strrep(string(labeledBandwidth.CenterFrequency/1e6),".",",")+...
        "MHz_BW"+string(labeledBandwidth.Bandwidth/1e6)+"MHz_"+...
        string(datetime(labeledBandwidth.Timestamp,"Format","yyyyMMddHHmmssSSS"));
    save(fname,"labeledBandwidth","-v7.3")
end
Further Exploration
You can decode the bandwidth of an LTE carrier waveform using LTE Toolbox™. For more information, see the Cell Search, MIB and SIB1 Recovery (LTE Toolbox) example. Consider using LTE Toolbox to automatically set the bandwidth of the label for each detected LTE signal.
For NR, you cannot decode the bandwidth of the carrier waveform using 5G Toolbox™. However, decoding the MIB can confirm that a carrier waveform exists and can give the location of the SIB1 within the bandwidth of the carrier waveform. For more information on decoding the MIB, see the NR Cell Search and MIB and SIB1 Recovery (5G Toolbox) example. Consider using 5G Toolbox to automatically place the label of each detected NR signal within the bandwidth of the carrier waveform.