
Q_band_ZB_3dplot

Q_band_ZB_3dplot
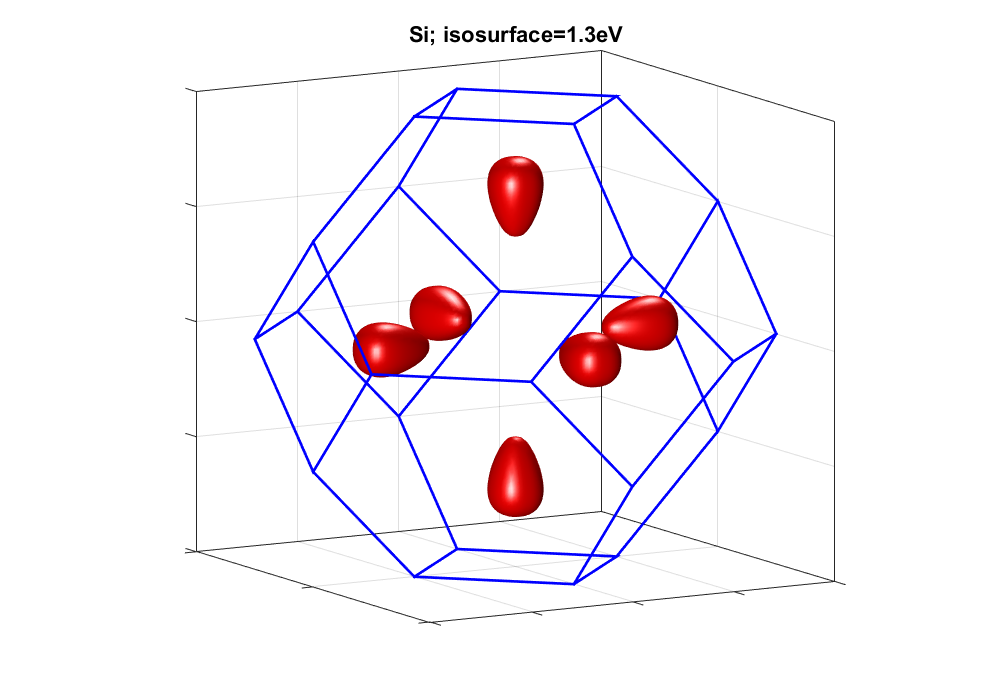
Computes and plot the electrons distribution in the ZB Brillouin zone
It uses the tight-binding model sp3s* where the parameters a from the following references:
-> for the III-V: KLIMECK et al, Superlattices and Microstructures, Vol. 27, No. 5/6, 2000
-> for Si: KLIMECK et al, Superlattices and Microstructures, Vol. 27, No. 2/3,2000
-> for Ge: VOGL et al, I. Phys. Chom. Solids Vol. 44, No. 5. pp. 365-378, 1983


Citar como
Laurent NEVOU (2024). Q_band_ZB_3dplot (https://github.com/LaurentNevou/Q_band_ZB_3dplot), GitHub. Recuperado .
Compatibilidad con la versión de MATLAB
Compatibilidad con las plataformas
Windows macOS LinuxEtiquetas
Community Treasure Hunt
Find the treasures in MATLAB Central and discover how the community can help you!
Start Hunting!Descubra Live Editor
Cree scripts con código, salida y texto formateado en un documento ejecutable.
No se pueden descargar versiones que utilicen la rama predeterminada de GitHub
| Versión | Publicado | Notas de la versión | |
|---|---|---|---|
| 1.0.1 | image updated |
|
|
| 1.0.0 |
|
También puede seleccionar uno de estos países/idiomas:
América
- América Latina (Español)
- Canada (English)
- United States (English)
Europa
- Belgium (English)
- Denmark (English)
- Deutschland (Deutsch)
- España (Español)
- Finland (English)
- France (Français)
- Ireland (English)
- Italia (Italiano)
- Luxembourg (English)
- Netherlands (English)
- Norway (English)
- Österreich (Deutsch)
- Portugal (English)
- Sweden (English)
- Switzerland
- United Kingdom (English)
Asia-Pacífico
- Australia (English)
- India (English)
- New Zealand (English)
- 中国
- 日本Japanese (日本語)
- 한국Korean (한국어)