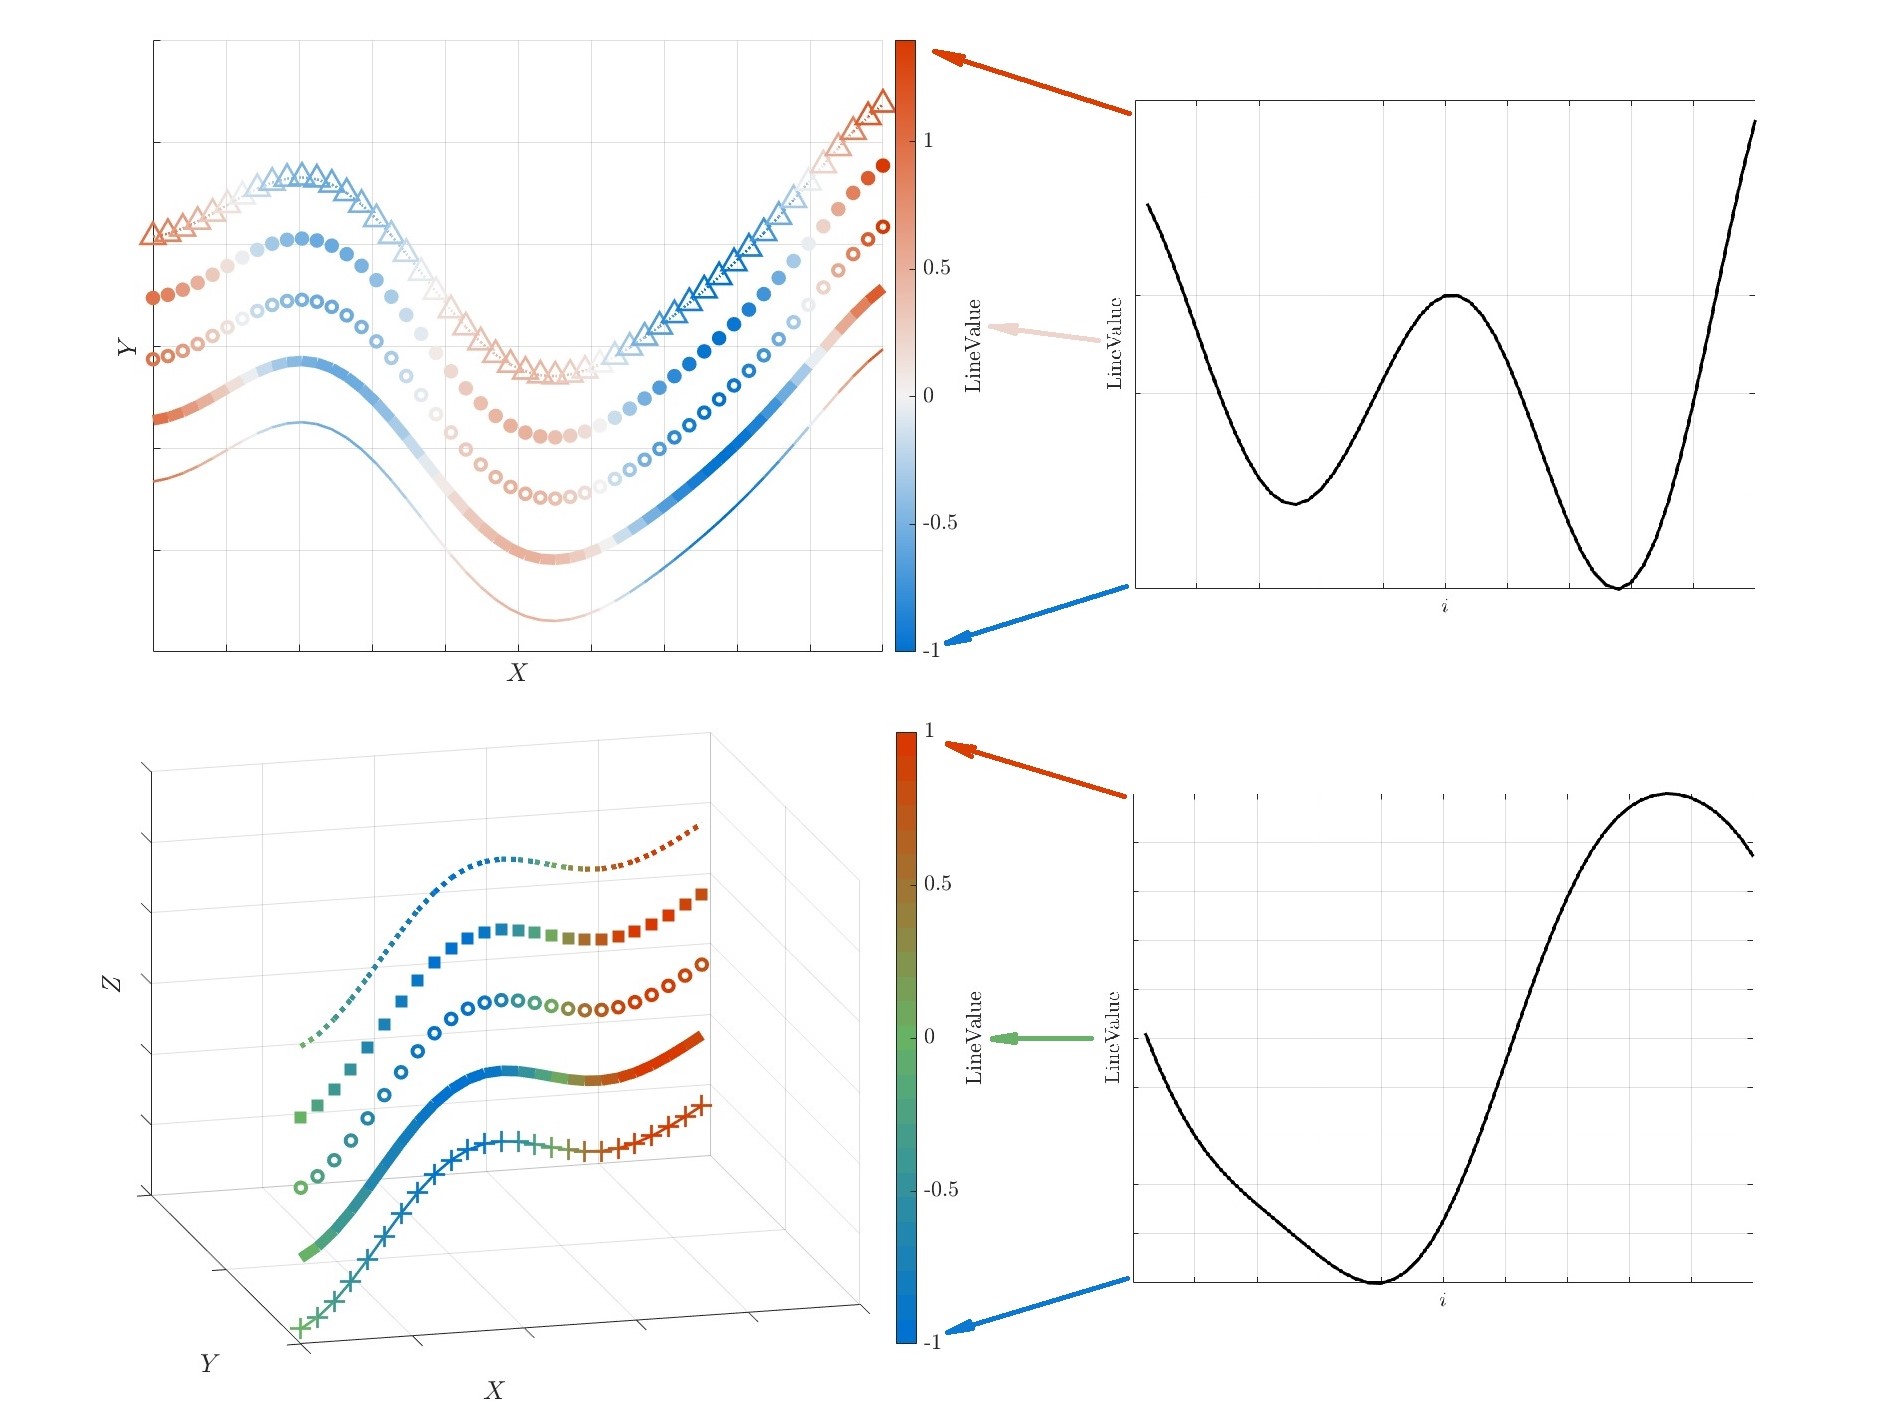
Plot colormapped lines and map values onto lines - plotcmap
Plots a colormapped 2-D or 3-D line that maps the values of another variable onto the colormap on the line. LineSpec available as in >>plot.

Ahora está siguiendo esta publicación
- Verá actualizaciones en las notificaciones de contenido en seguimiento.
- Podrá recibir correos electrónicos, en función de las preferencias de comunicación que haya establecido.
Citar como
Xiaowei He (2026). Plot colormapped lines and map values onto lines - plotcmap (https://la.mathworks.com/matlabcentral/fileexchange/110530-plot-colormapped-lines-and-map-values-onto-lines-plotcmap), MATLAB Central File Exchange. Recuperado .
Información general
- Versión (3,7 KB)
Compatibilidad con la versión de MATLAB
- Compatible con cualquier versión desde R2014b
Compatibilidad con las plataformas
- Windows
- macOS
- Linux
| Versión | Publicado | Notas de la versión | Action |
|---|---|---|---|
| 1.2.0 | - Added an output argument that displays the colorbar and returns the colorbar handle. E.g., [~, cb] = plotcmap(__). |
||
| 1.1.1 | - Fixed a bug that causes errors when plotting on target axes.
|
||
| 1.1.0 | - Added support for using MATLAB predefined colormaps.
|
||
| 1.0.0 |

