Ahora está siguiendo esta publicación
- Verá actualizaciones en las notificaciones de contenido en seguimiento.
- Podrá recibir correos electrónicos, en función de las preferencias de comunicación que haya establecido.
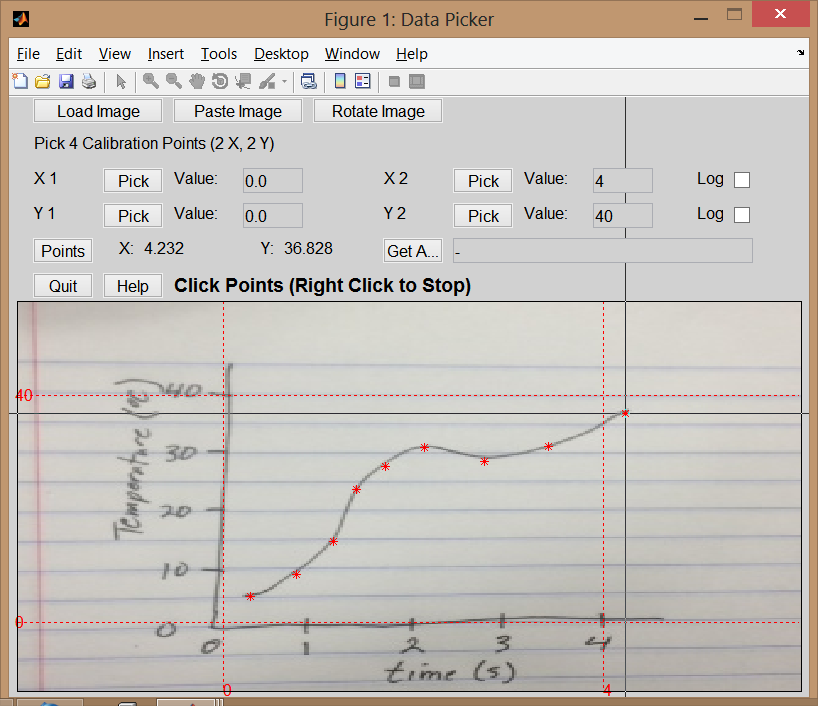
Often we receive data in graphical form (e.g. from data sheets), but want that same data in numerical form. This can be time consuming to manually read points from a graph. This package provides a GUI to assist in this task.
One simply identifies two known x-values and two known y-values from the graph image as reference points. Then one may click on any point on the graph and the GUI will return its x and y value.
Works with linear and log scales. Also generates axes data if you want to plot other data over your image at the same scaling.
For more information, please see http://www.nutaksas.com or http://www.convergentmc.com
Citar como
Travis Wiens (2026). Graph Picker (https://la.mathworks.com/matlabcentral/fileexchange/41313-graph-picker), MATLAB Central File Exchange. Recuperado .
Información general
- Versión 1.1.0.0 (158 KB)
Compatibilidad con la versión de MATLAB
- Compatible con cualquier versión
Compatibilidad con las plataformas
- Windows
- macOS
- Linux
