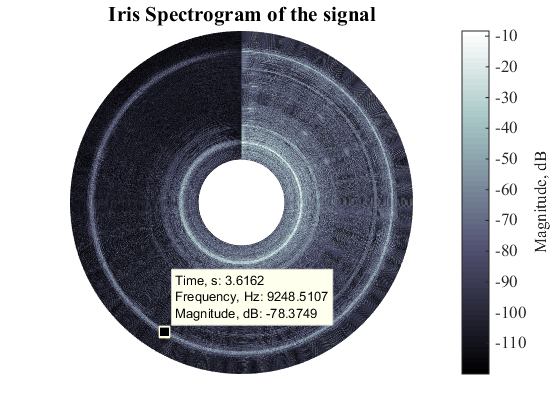
Spectrogram Visualization with Matlab
Irisgram - a new kind of visual representation of the time-frequency spectrogram.

Ahora está siguiendo esta publicación
- Verá actualizaciones en las notificaciones de contenido en seguimiento.
- Podrá recibir correos electrónicos, en función de las preferencias de comunicación que haya establecido.
Citar como
H. Zhivomirov. A Novel Visual Representation of the Signals in the Time-Frequency Domain. The Scientific Bulletin, Series C: Electrical Engineering and Computer Science, ISSN: 2286-3540, Vol. 80, Issue 3, pp. 75-84, 2018. (https://www.scientificbulletin.upb.ro/rev_docs_arhiva/rez786_869448.pdf)
Hristo Zhivomirov (2026). Spectrogram Visualization with Matlab (https://la.mathworks.com/matlabcentral/fileexchange/64882-spectrogram-visualization-with-matlab), MATLAB Central File Exchange. Recuperado .
Información general
- Versión (1,36 MB)
Compatibilidad con la versión de MATLAB
- Compatible con cualquier versión
Compatibilidad con las plataformas
- Windows
- macOS
- Linux

