Main Content

computeBoundaryModel

Obtain y-coordinates of lane boundaries given x-coordinates

Description

yWorld = computeBoundaryModel(boundaries,xWorld) computes the y-axis world coordinates of lane boundary models at the specified x-axis world coordinates.

  • If boundaries is a single lane boundary model, then yWorld is a vector of coordinates corresponding to the coordinates in xWorld.

  • If boundaries is an array of lane boundary models, then yWorld is a matrix. Each row or column of yWorld corresponds to a lane boundary model computed at the x-coordinates in row or column vector xWorld.

example

Examples

collapse all

Create a parabolicLaneBoundary object to model a lane boundary. Compute the positions of the lane along a set of x-axis locations.

Specify the parabolic parameters and create a lane boundary model.

parabolicParams = [-0.005 0.15 0.55];
lb = parabolicLaneBoundary(parabolicParams);

Compute the y-axis locations for given x-axis locations within the range of a camera sensor mounted to the front of a vehicle.

xWorld = 3:30; % in meters
yWorld = computeBoundaryModel(lb,xWorld);

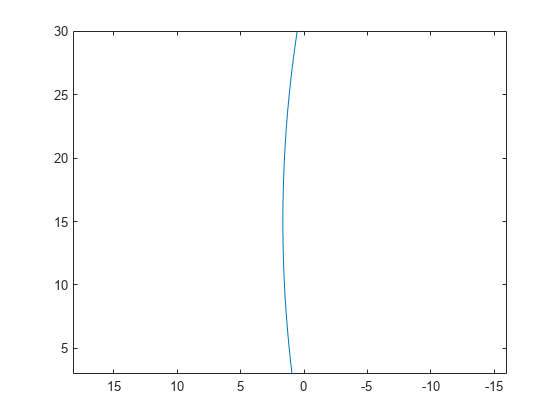
Plot the lane boundary points. To fit the coordinate system, flip the axis order and change the x-direction.

plot(yWorld,xWorld)
axis equal
set(gca,'XDir','reverse')

Figure contains an axes object. The axes object contains an object of type line.

Create a 3-meter-wide lane.

lb = parabolicLaneBoundary([-0.001,0.01,1.5]);
rb = parabolicLaneBoundary([-0.001,0.01,-1.5]);

Compute the lane boundary model manually from 0 to 30 meters along the x-axis.

xWorld = (0:30)';
yLeft = computeBoundaryModel(lb,xWorld);
yRight = computeBoundaryModel(rb,xWorld);

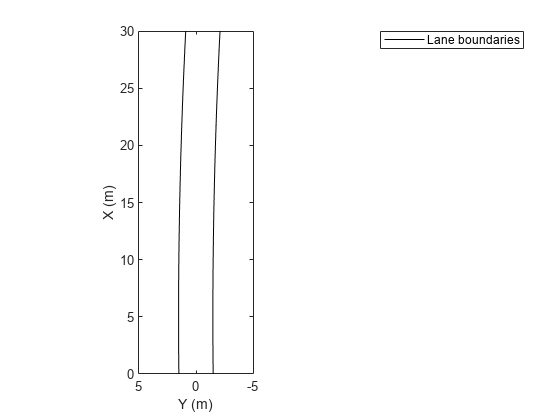
Create a bird's-eye plot and lane boundary plotter. Display the lane information on the bird's-eye plot.

bep = birdsEyePlot('XLimits',[0 30],'YLimits',[-5 5]);
lanePlotter = laneBoundaryPlotter(bep,'DisplayName','Lane boundaries');
plotLaneBoundary(lanePlotter,{[xWorld,yLeft],[xWorld,yRight]});

Figure contains an axes object. The axes object with xlabel X (m), ylabel Y (m) contains an object of type line. This object represents Lane boundaries.

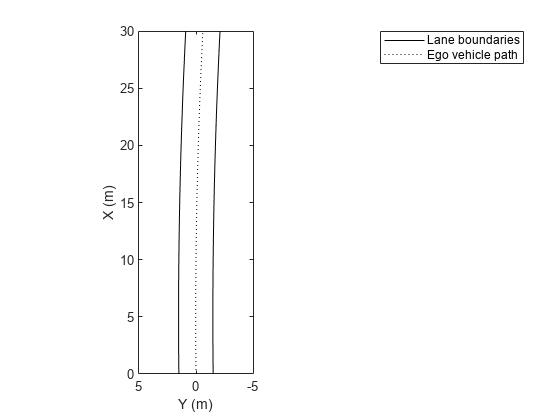
Create a path plotter. Create and display the path of an ego vehicle that travels through the center of the lane.

yCenter = (yLeft + yRight)/2;
egoPathPlotter = pathPlotter(bep,'DisplayName','Ego vehicle path');
plotPath(egoPathPlotter,{[xWorld,yCenter]});

Figure contains an axes object. The axes object with xlabel X (m), ylabel Y (m) contains 2 objects of type line. These objects represent Lane boundaries, Ego vehicle path.

Find candidate ego lane boundaries from an array of lane boundaries.

Create an array of cubic lane boundaries.

lbs = [cubicLaneBoundary([-0.0001, 0.0, 0.003,  1.6]), ...
       cubicLaneBoundary([-0.0001, 0.0, 0.003,  4.6]), ...
       cubicLaneBoundary([-0.0001, 0.0, 0.003, -1.6]), ...
       cubicLaneBoundary([-0.0001, 0.0, 0.003, -4.6])];

For each lane boundary, compute the y-axis location at which the x-coordinate is 0.

xWorld = 0; % meters
yWorld = computeBoundaryModel(lbs,0);

Use the computed locations to find the ego lane boundaries that best meet the criteria.

leftEgoBoundaryIndex = find(yWorld == min(yWorld(yWorld>0)));            
rightEgoBoundaryIndex = find(yWorld == max(yWorld(yWorld<=0)));
leftEgoBoundary = lbs(leftEgoBoundaryIndex);
rightEgoBoundary = lbs(rightEgoBoundaryIndex);

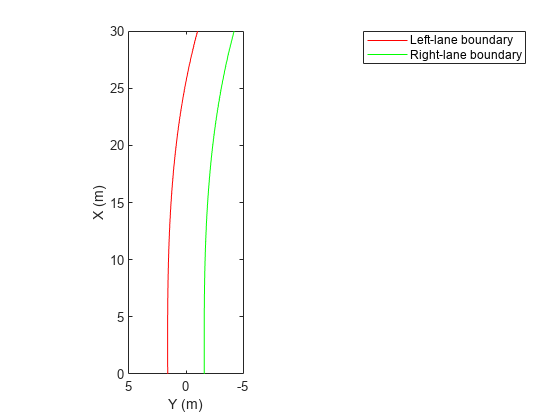
Plot the boundaries using a bird's-eye plot and lane boundary plotter.

bep = birdsEyePlot('XLimits',[0 30],'YLimits',[-5 5]);
lbPlotter = laneBoundaryPlotter(bep,'DisplayName','Left-lane boundary','Color','r');
rbPlotter = laneBoundaryPlotter(bep,'DisplayName','Right-lane boundary','Color','g');
plotLaneBoundary(lbPlotter,leftEgoBoundary)
plotLaneBoundary(rbPlotter,rightEgoBoundary)

Figure contains an axes object. The axes object with xlabel X (m), ylabel Y (m) contains 2 objects of type line. These objects represent Left-lane boundary, Right-lane boundary.

Input Arguments

collapse all

Lane boundary models containing the parameters used to compute the y-axis coordinates, specified as a lane boundary object or an array of lane boundary objects. Valid objects are parabolicLaneBoundary and cubicLaneBoundary.

x-axis locations of the boundaries in world coordinates, specified as a real scalar or real-valued vector.

Extended Capabilities

C/C++ Code Generation
Generate C and C++ code using MATLAB® Coder™.

Version History

Introduced in R2017a