Visualize Task Scheduling in XCP External Mode Simulation
If you run an XCP-based external mode simulation with code execution profiling enabled, you can use the Simulation Data Inspector to visualize how the target hardware executes generated code.
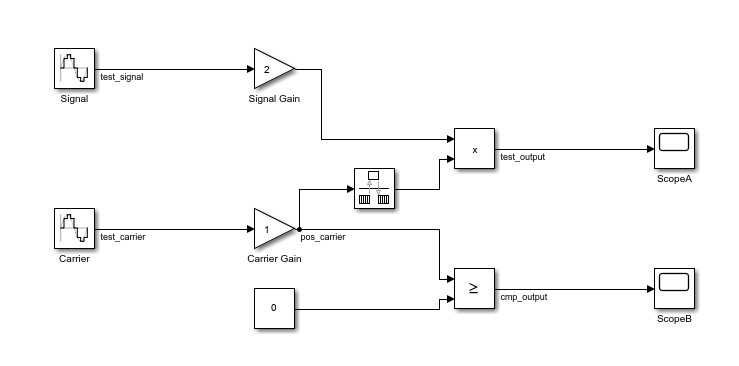
This example shows how to configure and run the simulation and display task activity and diagnostics and CPU activity and utilization.
Model Configuration
Treat each discrete rate as a separate task.
set_param(gcs, 'EnableMultiTasking', 'on');
Enable code execution profiling.
set_param(gcs, 'CodeExecutionProfiling', 'on');
set_param(gcs, 'CodeProfilingInstrumentation', 'Detailed');
set_param(gcs, 'CodeProfilingSaveOptions', 'AllData');
Open the Simulation Data Inspector.
Simulink.sdi.view;
Start the simulation.
set_param(gcs, 'SimulationCommand', 'start');
Run-Time Visualization
In the Simulation Data Inspector, the Inspect pane provides display groups. This table describes the profiling information that is available.
| Display Group | Information Available |
|---|---|
Profiling | For each task, the variation of execution time over simulation time. |
Task Activity | For each task, the variation of its state over time. A task can be in one of these states:
|
Task Diagnostics | For each task:
The software uses a rate-monotonic analysis to determine task priorities. Task diagnostics are available only for target applications that are generated to run on:
|
CPU Activity | For each CPU core, the names of tasks that run on the CPU core over
simulation time. At any instant, if no task is running on the CPU core, the
value |
CPU Utilization | For each CPU core that tasks run on, normalized utilization over simulation time. Utilization values range between 0.0 and 1.0. For example, a value of 0.4 indicates that the CPU core is active for 40% of the time and idle for 60% of the time. |
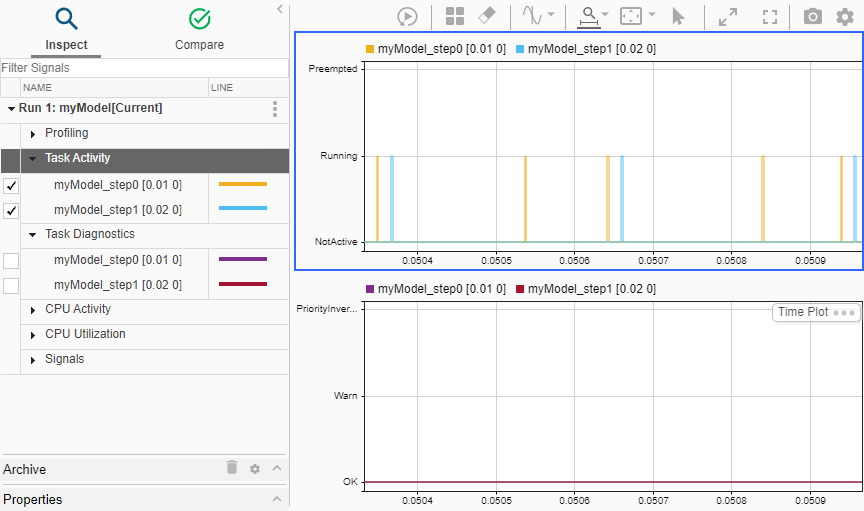
To monitor task preemption and priority inversion:
Select a subplot. Then, on the Inspect pane, from the Task Activity display group, select the myModel_step0 [0.01 0] and myModel_step1 [0.02 0] check boxes.
Select the next subplot. Then, on the Inspect pane, from the Task Diagnostics display group, select the myModel_step0 [0.01 0] and myModel_step1 [0.02 0] check boxes.
Using the Zoom in Time (Ctrl+Shift+T) control, view a specific time section.
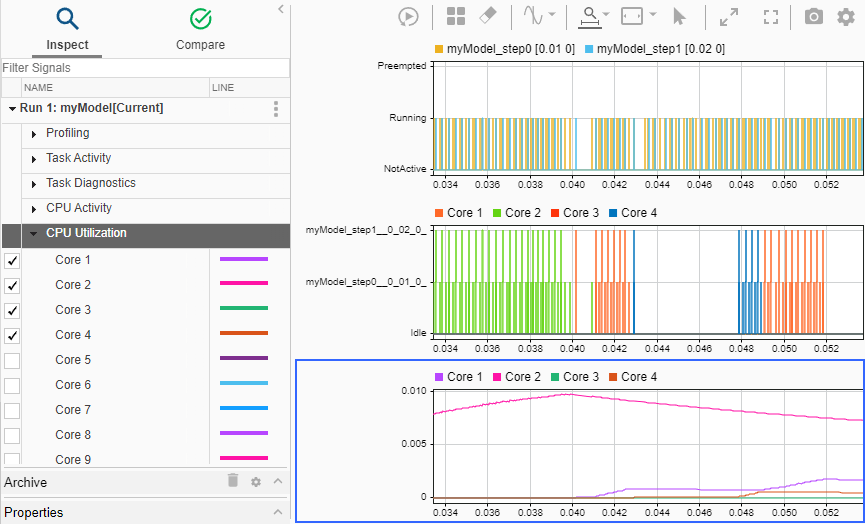
To monitor CPU core activity and utilization:
Select a subplot. On the Inspect pane, from the CPU Activity display group, select, for example, the Core 1, Core 2, Core 3, and Core 4 check boxes.
Select the next subplot. On the Inspect pane, from the CPU Utilization display group, select, for example, the Core 1, Core 2, Core 3, and Core 4 check boxes.
Using the Zoom in Time (Ctrl+Shift+T) control, view a specific time section.
Offline Visualization
After the completion of the simulation, you can use the schedule
function to regenerate displays (except for task diagnostics). For this example,
run:
schedule(executionProfile)
The function adds the task activity, CPU core activity, and CPU core utilization displays to the Profiling group. By default, the function produces eight subplots.
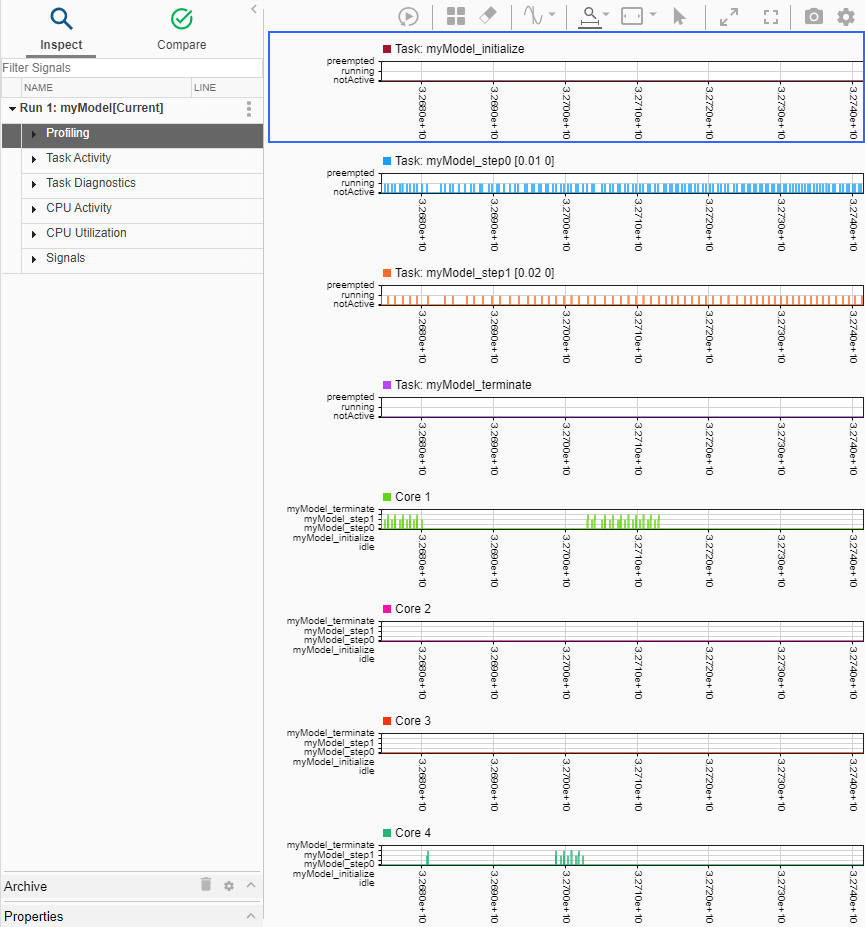
To visualize specific task scheduling and related CPU activity for specific tasks, you
can use Simulink.sdi functions. For example, to observe task activity for
myModel_step0 and myModel_step1 and CPU core
activity and utilization for Core 4:
Clear the displays and specify three subplots.
Simulink.sdi.clearAllSubPlots;
Simulink.sdi.setSubPlotLayout(3,1);
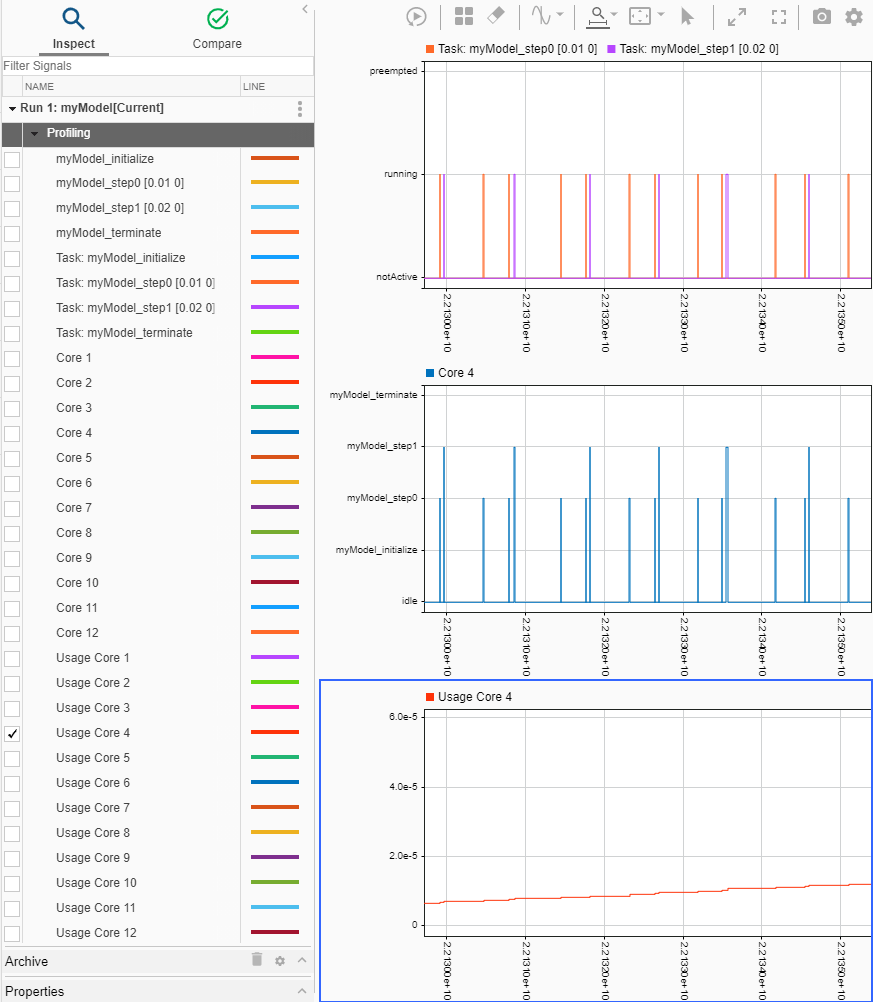
In the Simulation Data Inspector, perform these actions:
Click subplot 1, and then select the Task: myModel_step0 [0.01 0] and Task: myModel_step1 [0.02 0] check boxes.
Click subplot 2, and then select the Core 4 check box.
Click subplot 3, and then select the Usage Core 4 check box.
Using the Zoom in Time (Ctrl+Shift+T) control, view activity for a specific time section.
Detect Task Overrun Events
To produce, for each task, a diagnostic signal that represents the number of overrun events, specify these configuration parameters.
set_param(gcs, 'ConcurrentTasks', 'on');
set_param(gcs, 'EnableMultiTasking', 'on');
set_param(gcs, 'TargetOS', 'NativeThreadsExample');
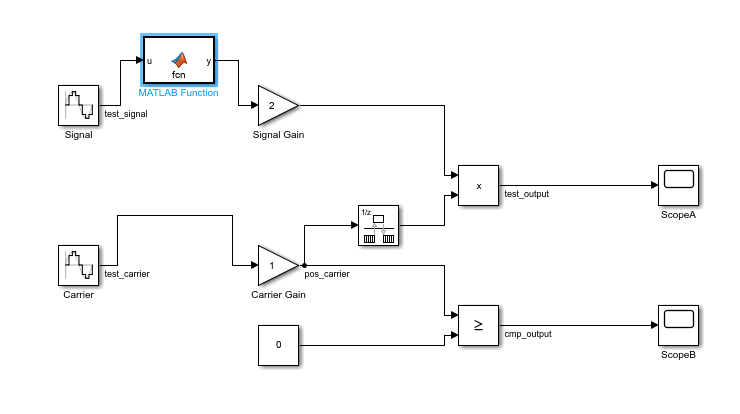
To produce overrun events in the myModel_step0 task, in
myModel, add a MATLAB Function block that implements an
active wait by using this
function:
function y = fcn(u)

tic;
while(true)
    t = toc;
    if t > 0.016
        break;
    end
end
y = u;
To reduce the data upload demand, disable function profiling:
set_param(gcs, 'CodeProfilingInstrumentation', 'off');
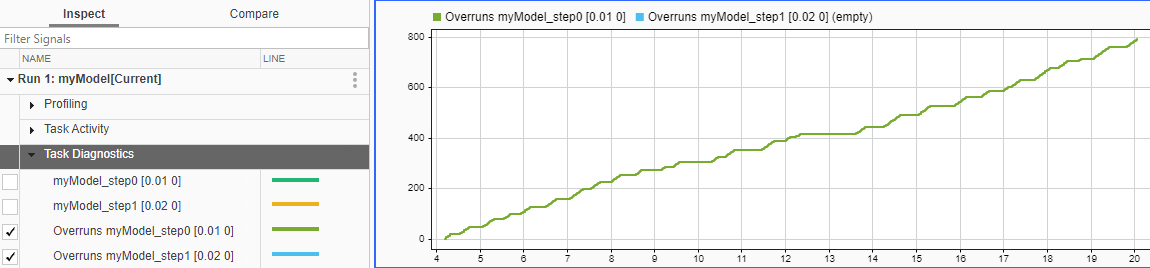
Run a simulation, which streams the diagnostic signals to the Simulation Data Inspector. To monitor the number of overrun events, on the Inspect pane, from the Task Diagnostics display group, select the Overruns myModel_step0 [0.01 0] and Overruns myModel_step1 [0.02 0] check boxes.
At the end of the simulation, you can use the Code Profile Analyzer to view the overrun rate (number of overrun events / number of calls) as a percentage. In the Command Window, enter:
coder.profile.show(executionProfile)
In the Task Execution panel, the Task Execution Times view shows execution-time metrics for generated code sections, which include the overrun rates.
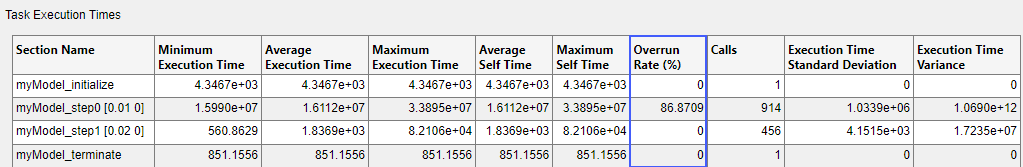
For information about the other metrics, see Analyze Task and Function Execution Times.