priceandvol
Price and Volume chart
priceandvol is updated to accept data input as a matrix, timetable, or table.
The syntax for priceandvol has changed. Previously, when using
table input, the first column of dates could be a datetime array, date character
vectors, or serial date numbers, and you were required to have specific number of
columns.
When using table input, the new syntax for priceandvol supports:
No need for time information. If you want to pass in date information, use timetable input.
No requirement of specific number of columns. However, you must provide valid column names.
linebreakmust contain columns named'open','high','low','close', and'volume'(case insensitive).
Description
Examples
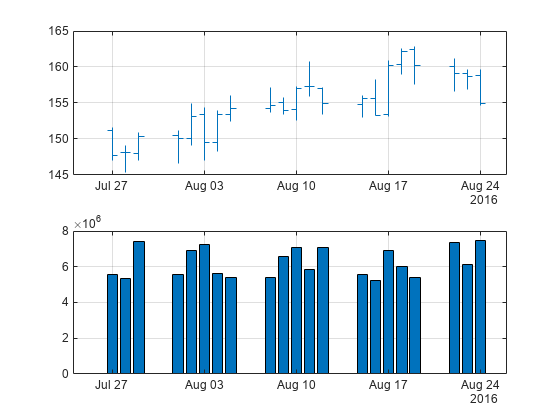
Load the file SimulatedStock.mat, which provides a timetable (TMW) for financial data for TMW stock. This price and volume chart for the TMW stock contains the open, high, low, close, and volume for the most recent 21 days.
load SimulatedStock.mat
priceandvol(TMW(end-20:end,:));