trackPlotter
R2026bTrack plotter for theater plot
Description
A TrackPlotter object defines a track plotter belonging to a
theaterPlot object. Use the
plotTrack function to plot
tracks using the TrackPlotter object.
Creation
Description
tPlotter = trackPlotter(tp)TrackPlotter object for use with the theater plot
tp.
tPlotter = trackPlotter(tp,Name,Value)TrackPlotter object with additional options specified by one or
more name-value arguments. Specify optional properties using
name-value arguments.
Input Arguments
Properties
Plot name to display in legend, specified as a character vector or string scalar. If you do not specify this property, no entry is shown in the legend.
Number of previous track updates to display, specified as a nonnegative integer less than or equal to 10,000. If set to 0, then no previous updates are rendered.
Connect tracks flag, specified as either 'on' or
'off'. When set to 'on', tracks with the same
label or track identifier between consecutive updates are connected with a line. This
property can only be specified when creating the TrackPlotter.
To use the trackIDs input argument
of plotTrack,
ConnectHistory must be 'on'. If trackIDs is omitted
when ConnectHistory is 'on', then the track
identifiers are derived from the labels input instead.
Colorize track history, specified as either 'on' or
'off'. When set to 'on', tracks with the same
label or track identifier between consecutive updates are connected with a line of a
different color. This property can only be specified when creating the
TrackPlotter.
ColorizeHistory is applicable only when
ConnectHistory is 'on'.
Marker symbol, specified as one of these symbols.
| Marker | Description | Resulting Marker |
|---|---|---|
"o" | Circle |
|
"+" | Plus sign |
|
"*" | Asterisk |
|
"." | Point |
|
"x" | Cross |
|
"_" | Horizontal line |
|
"|" | Vertical line |
|
"square" | Square |
|
"diamond" | Diamond |
|
"^" | Upward-pointing triangle |
|
"v" | Downward-pointing triangle |
|
">" | Right-pointing triangle |
|
"<" | Left-pointing triangle |
|
"pentagram" | Pentagram |
|
"hexagram" | Hexagram |
|
"none" | No markers | Not applicable |


Size of marker in points, specified as a positive integer.
Marker outline color, specified as a character vector, a string scalar, an RGB triplet, or a hexadecimal color code.
Marker fill color, specified as a character vector, a string scalar, an RGB
triplet, a hexadecimal color code, or 'none'.
Font size for labeling tracks, specified as a positive integer that represents font point size.
Gap between label and positional point it annotates, specified as a three-element row vector. Specify the [x y z] offset in meters.
Scale factor for magnitude length of velocity vectors, specified as a positive
scalar. The plot renders the magnitude vector value as VK, where
V is the magnitude of the velocity in meters per second, and
K is the value of VelocityScaling.
Tag associated with the plotter, specified as a character vector or string scalar.
The default value is 'PlotterN', where
N is an integer that corresponds to the Nth
plotter associated with the theaterPlot. You can
use the findPlotter
function to identify plotters based on their tag.
Since R2026a
Covariance patch outline color, specified as a character vector, a string scalar, or an RGB triplet.
Since R2026a
Covariance patch fill color, specified as a character vector, a string scalar, or an RGB triplet.
Since R2026a
Face alpha value for covariance patch, specified as a scalar in the range
[0 1].
Object Functions
plotTrack | Plot set of tracks in theater track plotter |
clearData | Clear data from specific plotter of theater plot |
clearPlotterData | Clear plotter data from theater plot |
Examples
Create a theater plot. Create a track plotter with DisplayName set to 'Tracks' and with HistoryDepth set to 5.
tp = theaterPlot('XLim',[0,90],'YLim',[-35,35]);
tPlotter = trackPlotter(tp,'DisplayName','Tracks','HistoryDepth',5);
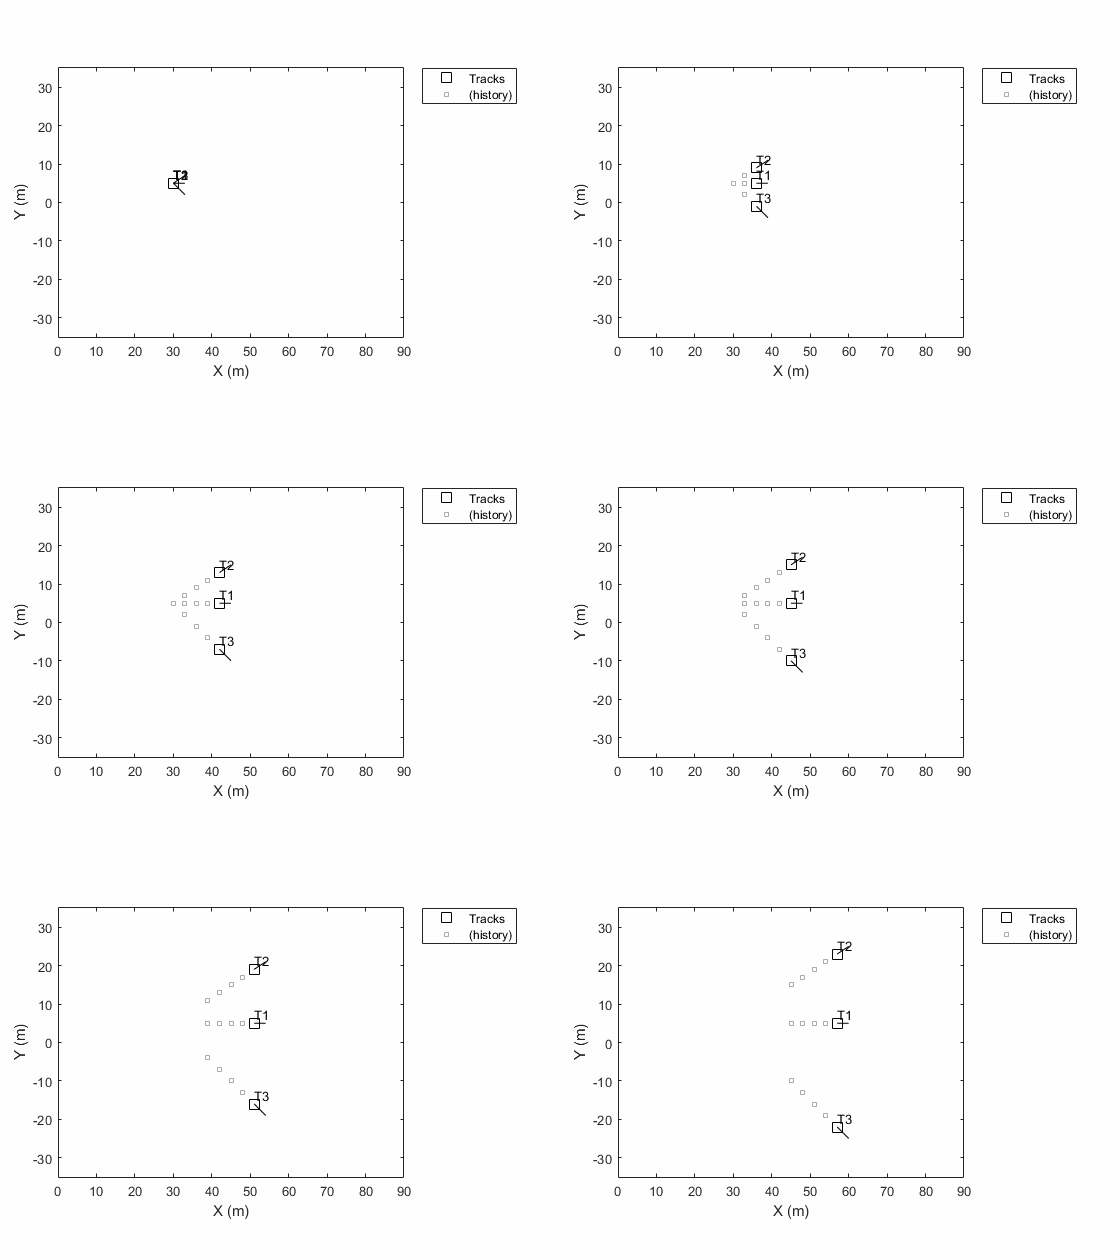
Update the track plotter with three tracks labeled 'T1', 'T2', and 'T3' with start positions in units of meters all starting at (30, 5, 1) with corresponding velocities (in m/s) of (3, 0, 1), (3, 2, 2) and (3, -3, 5), respectively. Update the tracks with the velocities for ten iterations.
positions = [30, 5, 1; 30, 5, 1; 30, 5, 1];
velocities = [3, 0, 1; 3, 2, 2; 3, -3, 5];
labels = {'T1','T2','T3'};
for i=1:10
    plotTrack(tPlotter, positions, velocities, labels)
    positions = positions + velocities;
end
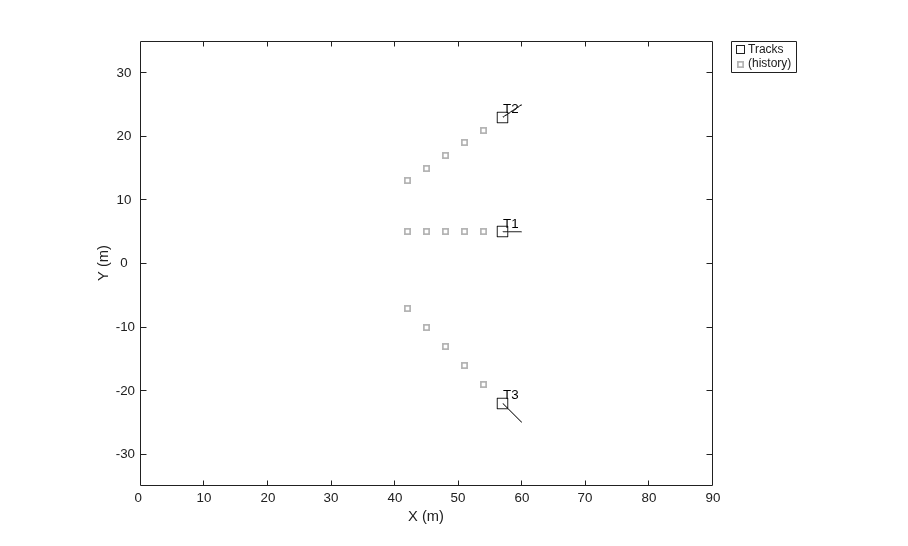
This animation loops through all the generated plots.