Main Content

gpucoder.profile

(Not recommended) Create an execution profile report for generated CUDA code

gpucoder.profile is not recommended. Use gpuPerformanceAnalyzer instead. For more information, see Compatibility Considerations.

Description

example

gpucoder.profile(func_name,codegen_inputs) generates an execution profiling report of the CUDA code generated for the design file func_name. The codegen_inputs argument specifies the inputs to the design file. You must install the Embedded Coder® product to generate the profiling report.

Note

The profiling workflow depends on profiling tools from NVIDIA®. From CUDA® Toolkit v10.1 onwards, NVIDIA restricts access to performance counters to admin users. To enable GPU performance counters for all user accounts, see the instructions in Permission issue with Performance Counters (NVIDIA).

Note

The profiling tools from NVIDIA might not support legacy GPU hardware such as the Kepler family of devices. For information on supported GPU devices, see the NVIDIA documentation.

gpucoder.profile(___,Name,Value) generates an execution profiling report with one or more profiling options specified as a name-value pair argument.

Examples

collapse all

Perform fine-grain analysis for a MATLAB algorithm and its generated CUDA code through software-in-the-loop (SIL) execution profiling. You must install the Embedded Coder product to generate the execution profiling report.

Write an entry-point function that performs N-D fast Fourier transform. To map the FFT to the GPU, use the coder.gpu.kernelfun pragma. By default, the EnableCUFFT property is enabled, so the code generator uses the cuFFT library to perform the FFT operation.

function [Y] = gpu_fftn(X)
  coder.gpu.kernelfun();
  Y = fftn(X);
end

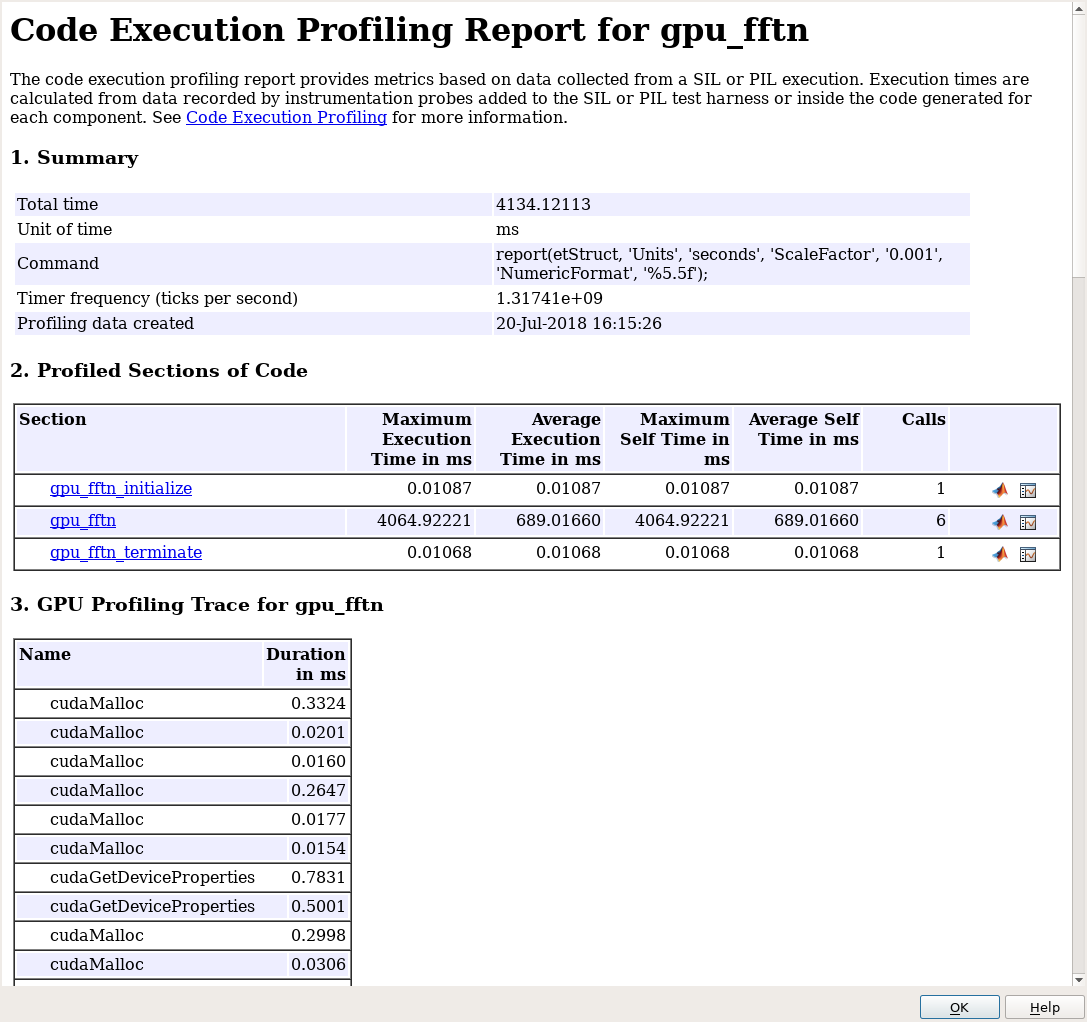
To generate the execution profiling report, use the gpucoder.profile function.

cfg = coder.gpuConfig('exe');
cfg.GpuConfig.MallocMode = 'discrete';
gpucoder.profile('gpu_fftn',{rand(2,4500,4)},'CodegenConfig',cfg,...
    'CodegenArguments','-d profilingdir','Threshold',0.001);

The code execution profiling report provides metrics based on data collected from a SIL execution. Execution times are calculated from data recorded by instrumentation probes added to the SIL test harness or inside the code generated for each component. For more information, see View Execution Times (Embedded Coder).

Input Arguments

collapse all

Name of the entry-point function or design file.

Example: gpucoder.profile('xdot',{1000,rand(1000,1),1,1,rand(1000,1),1,1})

Compile-time inputs to the entry-point function or design file.

Example: gpucoder.profile('xdot',{1000,rand(1000,1),1,1,rand(1000,1),1,1})

Name-Value Arguments

Specify optional pairs of arguments as Name1=Value1,...,NameN=ValueN, where Name is the argument name and Value is the corresponding value. Name-value arguments must appear after other arguments, but the order of the pairs does not matter.

Before R2021a, use commas to separate each name and value, and enclose Name in quotes.

Example: gpucoder.profile('xdot', {1000,rand(1000,1),1,1,rand(1000,1),1,1},'NumCalls',2,'CodegenConfig',cfg,'CodegenArguments','-d discrete','Threshold',0.01)

Specify the number of times the profiled section of the code is run. The default is 6. The first run is excluded from the report because it is generally an outlier.

Specify the code generation configuration object used to generate CUDA code and the profiling report. When you do not specify this value, a default coder.EmbeddedCodeConfig object is used.

Specify additional codegen arguments as a string. The default value is NULL (empty string).

To control the GPU calls that are displayed in the report, use the threshold value. Any function call with execution time under the value for the threshold parameter will be filtered from the profiling trace.

Version History

Introduced in R2018b

collapse all

R2023a: gpucoder.profile will be removed

The gpucoder.profile function will be removed in a future release. To visualize code metrics and identify optimization and tuning opportunities in your code, use gpuPerformanceAnalyzer instead.

This table shows typical usages of gpucoder.profile and how to update your code to use gpuPerformanceAnalyzer instead.

Not RecommendedRecommended

Profiling using gpucoder.profile:

gpucoder.profile('xdot', ...
{1000,rand(1000,1),1,1,rand(1000,1),1,1})

Profiling using gpuPerformanceAnalyzer:

gpucoder.profile('xdot', ...
{1000,rand(1000,1),1,1,rand(1000,1),1,1})

Passing extra arguments to the gpucoder.profile function.

cfg = coder.gpuConfig('exe');

gpucoder.profile('xdot', ...
{1000,rand(1000,1),1,1,rand(1000,1),1,1},...
'NumCalls',2,'CodegenConfig',cfg, ...
'CodegenArguments','-d PerfTest', ...
'Threshold',0.01)

Passing extra arguments to the gpuPerformanceAnalyzer function.

cfg = coder.gpuConfig('exe');

gpuPerformanceAnalyzer('xdot', ...
{1000,rand(1000,1),1,1,rand(1000,1),1,1},...
Config=cfg, NumIterations=2, ...
OutFolder="PerfTest")

The 'Threshold' name-value pair argument is not available in gpuPerformanceAnalyzer interface. Instead, use the Event Threshold option in the report window to filter events based on a time threshold.