mapaxes
R2026bDescription
Create Map Axes
mapaxes creates the default map axes in the current figure. By
default, the function creates a world map that uses an Equal Earth projection.
Use the mapaxes function when you want advanced control of the
map axes, or when you want to include the map axes in an app. In other cases, create a map
axes by using the newmap
function.
mapaxes( specifies options for
the map axes using one or more name-value arguments. For example,
Name=Value)FontSize=14 sets the font size for the map axes text to 14 points.
For a list of properties, see MapAxes Properties.
mapaxes( creates the
map axes in the object specified by parent,___)parent, instead of in the current
figure, in addition to any combination of inputs from the previous syntaxes.
mx = mapaxes(___) returns the
MapAxes object. Use mx to query and modify
properties of the MapAxes object after creation. For a list of
properties, see MapAxes Properties.
Examples
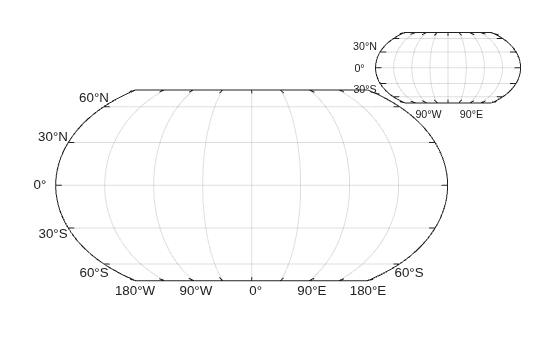
Create a map with an inset map by positioning two MapAxes objects in a figure.
Specify the position of the first MapAxes object so that it has a lower-left corner at the point (0.1, 0.1) with a width and height of 0.7. Specify the position of the second Axes object so that it has a lower-left corner at the point (0.67, 0.67) with a width and height of 0.26. By default, mapaxes normalizes the values to the figure. Return the MapAxes objects as mx1 and mx2.
figure
mx1 = mapaxes(Position=[0.1 0.1 0.7 0.7]);
mx2 = mapaxes(Position=[0.67 0.67 0.26 0.26]);
Read a shapefile containing world land areas into the workspace as a geospatial table. The table represents the land areas using polygon shapes in geographic coordinates. Extract the table row for Australia.
world = readgeotable("landareas.shp");
australia = geocode("australia",world);
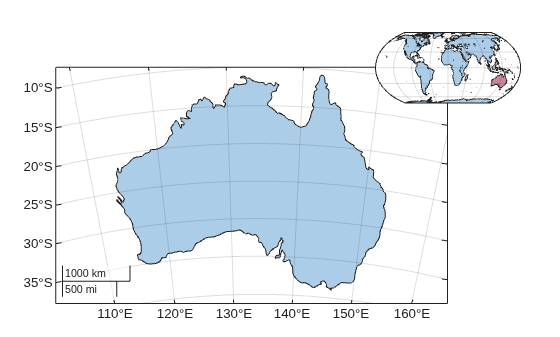
Change the projected coordinate reference system (CRS) of the first map axes to a CRS appropriate for Australia. Then, display the Australia polygon in the first axes.
mx1.ProjectedCRS = projcrs(3112);
geoplot(mx1,australia)
Display the global land area polygons and the Australia polygon in the second map axes. Use red for the Australia polygon.
geoplot(mx2,world)
hold on
geoplot(mx2,australia,"red")
Hide the ticks and tick labels on the second map axes by setting the TickDir and FontColor properties.
mx2.TickDir = "none";
mx2.FontColor = "none";
Since R2026b
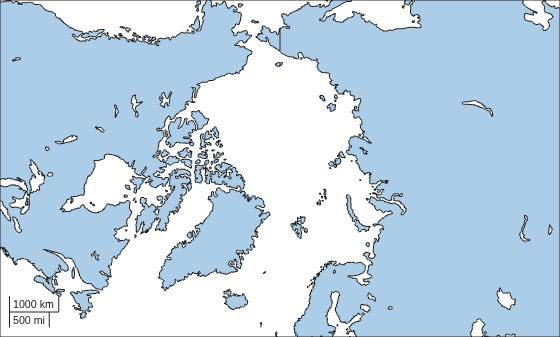
Create a map that uses a projected CRS that is appropriate for an arctic region. Maximize the axes within the figure by specifying the MapLayout argument as "maximized". Maximizing the axes hides the ticks, tick labels, graticule, and titles.
figure
pcrs = projcrs(3995);
mapaxes(ProjectedCRS=pcrs,MapLayout="maximized")
Retain the maximized map layout by setting the hold state of the axes to on. Then, display polygons representing land areas on the map.
hold on

land = readgeotable("northernhemisphere.shp");
geoplot(land)
Copyright 2026 The MathWorks, Inc.
Create two MapAxes objects and specify their positions. Return the MapAxes objects as mx1 and mx2.
figure
mx1 = mapaxes(Position=[0.1 0.1 0.45 0.45]);
mx2 = mapaxes(Position=[0.5 0.5 0.45 0.45]);
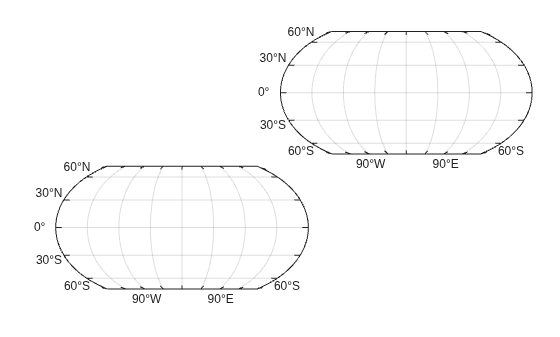
Make mx1 the current axes. This action makes the axes the target for subsequent graphics functions. Display polygons representing global land areas on the axes.
mapaxes(mx1)
land = readgeotable("landareas.shp");
geoplot(land)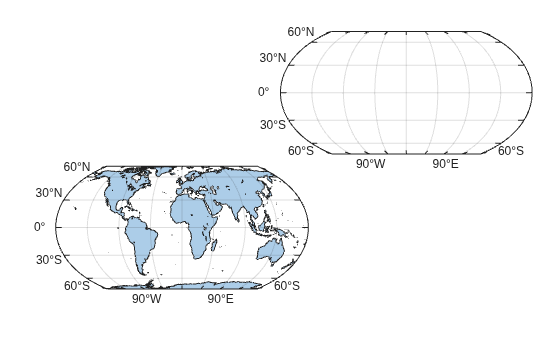
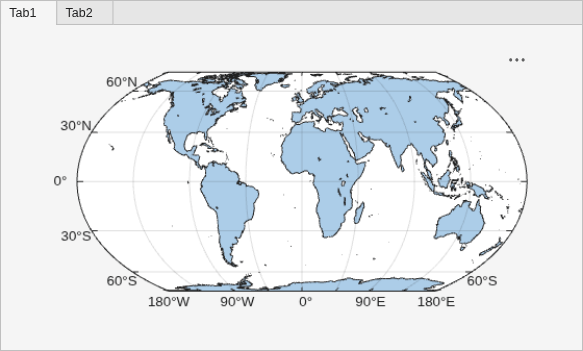
Create a figure with two tabs. Add a map axes to each tab by specifying the parent container for each axes.
figure
tab1 = uitab(Title="Tab1");
mx1 = mapaxes(tab1);

tab2 = uitab(Title="Tab2");
mx2 = mapaxes(tab2);
Plot polygons representing global land areas in the first tab and points representing global cities in the second tab.
land = readgeotable("landareas.shp");
geoplot(mx1,land)

cities = readgeotable("worldcities.shp");
geoplot(mx2,cities)
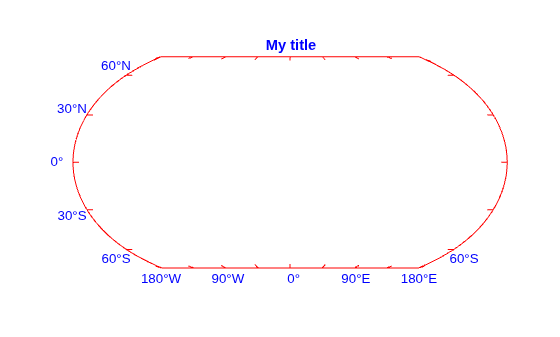
Create a map axes with a title. Remove the graticule lines, specify the map outline color, and specify the font color using name-value arguments.
mapaxes(GraticuleLineStyle="none",OutlineColor="r",FontColor="b")
title("My title")
Alternatively, you can set properties of the MapAxes object after creation by returning the MapAxes object as a variable.
figure
mx = mapaxes;
title("My title")

mx.GraticuleLineStyle = "none";
mx.OutlineColor = "r";
mx.FontColor = "b";
To use a different color for the title than for the tick labels, set the Color property of the title.
mx.Title.Color = "k";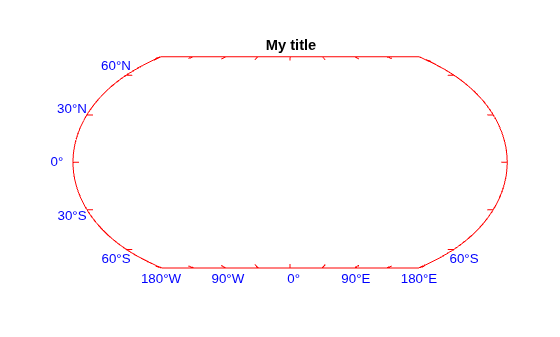
Input Arguments
Name-Value Arguments
Specify optional pairs of arguments as
Name1=Value1,...,NameN=ValueN, where Name is
the argument name and Value is the corresponding value.
Name-value arguments must appear after other arguments, but the order of the
pairs does not matter.
Example: mapaxes(Position=[0.3 0.3 0.5 0.5]) specifies the position of
the map axes so that is has a lower-left corner at the point (0.3, 0.3) with a width and
height of 0.5. By default, mapaxes normalizes the values to the
figure.
Note
Use name-value arguments to specify values for the properties of the
MapAxes objects created by this function. The properties listed here
are only a subset. For a full list, see MapAxes Properties.
Projected coordinate reference system (CRS), specified as a projcrs
object. MapAxes objects use the projection method and projection
parameters stored in the projected CRS to transform geographic (latitude-longitude)
coordinates to projected (xy) coordinates.
When you change the projected CRS, MATLAB® automatically updates the map axes to use the new projected CRS.
To change the projection parameters of the CRS, access the underlying ProjectionParameters property of the projcrs object.
p = projcrs(26919);
newmap(p)
mx = gca;
mx.ProjectionParameters.LongitudeOfNaturalOrigin = -75;
For examples of how to customize the projection used by map axes, see Change Projection and Projection Parameters.
By default, map axes objects use the World Geodetic System of 1984 (WGS 84) / Equal
Earth Greenwich projected CRS, which has the EPSG code 8857.
The projected CRS must have a forward and inverse projection implementation. Most projected CRSs have a forward and inverse projection implementation.
If you specify a projcrs object with a vertical CRS, the map axes
stores the projcrs object with the vertical CRS removed.
Map layout, specified as one of these options:
"normal"— Display the map in a box that is inset from the edges of the parent container. For many projected CRSs, this box includes the quadrangle defined byCartographicLatitudeLimitsandCartographicLongitudeLimitsand some areas surrounding the quadrangle. The axes does not display data where the projection has undefined numeric results or extreme map distortion. This option is appropriate for most data visualization and exploration."cartographic"— Display only the data within the quadrangle defined by theCartographicLatitudeLimitsandCartographicLongitudeLimitsproperties. This option is useful when creating static maps or when preparing maps for publication. For more information about creating maps using the"cartographic"option, see Create Map of Quadrangle Using Cartographic Map Layout."maximized"— Maximize the map by filling the available space within the parent container. Hide the ticks, tick labels, graticule, and titles. This option makes thePositionandOuterPositionproperties equal. This option is useful when you want to emphasize the content of the map, such as when creating an app. (since R2026b)
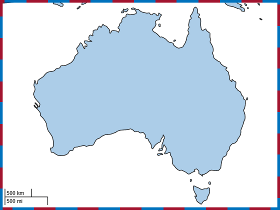
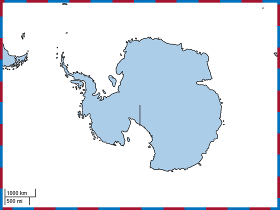
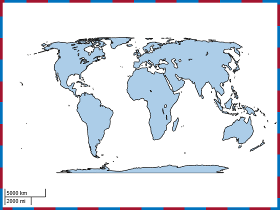
This table compares the "normal", "cartographic", and "maximized" options for several projected CRSs. The figures within the table show the box specified by Position in red and the box specified by OuterPosition in blue.
| Projected CRS |
"normal"
|
"cartographic"
|
"maximized"
|
|---|---|---|---|
|
A projected CRS for a temperate region. This row shows maps created from a |
|
|
|
|
A projected CRS for a polar region. This row shows maps created from a |
|
|
|
|
A projected CRS for a global region. This row shows maps created from a In this case, the map layouts for the |
|
|
|






Size and location, excluding a margin for the labels, specified as a four-element vector of the form [left bottom width height]. By default, MATLAB measures the values in units normalized to the container. To change the units, set the Units property.
The
leftandbottomelements define the distance from the lower-left corner of the container (typically a figure, panel, or tab) to the lower-left corner of the position boundary.The
widthandheightelements are the position boundary dimensions.
If you want to specify the position and account for the text around the axes, then set the
OuterPosition property instead. This figure shows the areas
defined by the OuterPosition values (blue) and the
Position values (red).

Note
Setting this property has no effect when the parent container is a
TiledChartLayout object.
Size and location, including the labels and a margin, specified as a four-element vector of the form [left bottom width height]. By default, MATLAB measures the values in units normalized to the container. To change the units, set the Units property. The default value of [0 0 1 1] includes the whole interior of the container.
The
leftandbottomelements define the distance from the lower-left corner of the container (typically a figure, panel, or tab) to the lower-left corner of the outer position boundary.The
widthandheightelements are the outer position boundary dimensions.
This figure shows the areas defined by the OuterPosition values (blue) and the Position values (red).
Note
Setting this property has no effect when the parent container is a
TiledChartLayout object.
Position units, specified as one of these values.
Units | Description |
|---|---|
"normalized" (default) | Normalized with respect to the container, which is typically the figure or a panel. The
lower-left corner of the container maps to (0,0)
and the upper-right corner maps to (1,1). |
"inches" | Inches. |
"centimeters" | Centimeters. |
"characters" | Based on the default
|
"points" | Typography points. One point equals 1/72 of an inch. |
"pixels" | Pixels. On Windows® and Macintosh systems, the size of a pixel is 1/96th of an inch. This size is independent of your system resolution. On Linux® systems, the size of a pixel is determined by your system resolution. |
When specifying the units using a name-value argument during object creation, you must set the
Units property before specifying the properties that you want
to use these units, such as Position.

